FRDM Training Hub

cancel
Showing results for 
Show  only  | Search instead for 
Did you mean: 

FRDM Training Hub

FRDM Training Hub


Restricted Beta Program

  • Comprehensive software and tools for seamless prototyping and rapid development
  • Scale your project with modular, quick-start FRDM and expansion boards
  • Leverage our application code hub or GoPoint to access 180+ code snippets and demos

  • Leverage FRDM Training Hub to learn from the experts
  • Not sure where to start ?

Discussions

Sort by:
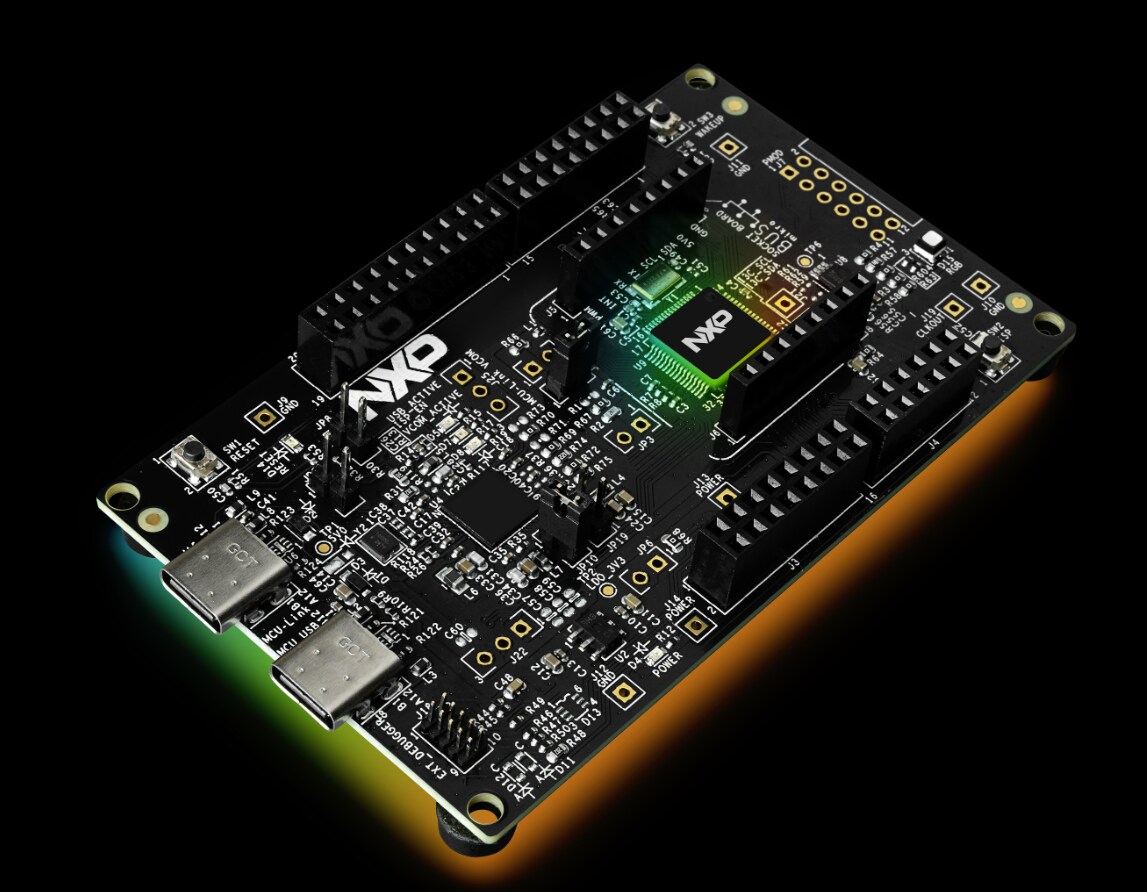
FRDM-IMX91S Hardware Introduction The FRDM i.MX 91S Development Board is a cost-effective, compact platform built around the i.MX 91 applications processor, optimized for embedded Linux development. It integrates the NXP IW610 wireless module, enabling robust Wi-Fi 6 + Bluetooth LE 5.4 / 802.15.4 connectivity for Industrial and IoT applications. Designed for rapid prototyping, the board supports GoPoint for i.MX Applications Processors, providing a suite of pre-integrated demos and reference implementations. The FRDM i.MX 91S features integrated 256MB NAND flash memory supporting direct boot (NAND boot). This includes a deeply trimmed, lightweight file system optimized for reliability and minimal resource consumption. Its small footprint maximizes usable storage while ensuring efficient operation. This file system serves as an ideal starting point – its modular design is fully customizable, allowing you to tailor it further to your specific application needs and optimize performance. Get to know FRDM-IMX91S Development Boaard Specifications i.MX 91 applications processor with 1x Arm® Cortex®-A55 LPDDR4 16-bit 512MB QSPI NAND Flash, 256MB Power Management IC (PMIC) MicroSD 3.0 card slot One USB 2.0 Type-C connector One USB 2.0 Type-C for debug One USB 2.0 Type-A connector One USB Type-C PD only Onboard Wi-Fi® 6 + Bluetooth® LE 5.4/802.15.4 module One 2x5 Pin NXP custom interface with: One CAN port Two channels for ADC I2C/I3C expansion One 1 Gbps Ethernet (ETER) External RTC with coin cell connector 40 pin (2 x 20) expansion I/O Feature FRDM-IMX91S SoC Package 11 x 11 NVM NAND flash 256 MB DRAM NANYA 512 MB PMIC PF9453 WiFi Module u-blox MAYA-W476 on-board USB TYPE C Type-C+Type-A ENET 1xGbe Display (Parallel RGB LCD) 2x20 EXPI Camera (Parallel Camera) 2x20 EXPI 2x20 Expansion Interface Y CAN BUS Y MicroSD Y UART Y Audio MQS Power Connector Type-C PCB layers 6 Base Board DIM 6.5 x 9.5 cm   NXP Devices On-board PMIC PF9453 Real time clock/calendar PCF2131 WIFI/BLE/802.15.4 Tri-Radio IW610 in u-blox module CAN Transceiver TJA1051T/3 IIC Extends GPIO PCAL6524   Expansion Boards ​8MIC-RPI-MX8: 8-microphone array proto board for voice enablement MX93AUD-HAT: Audio expansion board with multiple features Useful Links −i.MX Yocto Project User’s Guide​ −i.MX Linux User’s Guide ​−i.MX Linux Reference Manual​ −i.MX Porting Guide -i.MX Debian Linux SDK User Guide
View full article
In this lab, you will learn how to: Bring up Wi-Fi interfaces. Run basic Wi-Fi scan Configure and bring up Wi-Fi STA mode using WPA_SUPPLICANT. Configure and bring up UDHCP server for dynamic IP assignment for associated client devices. Run UDHCP client to get dynamic IP address. Configure and bring up Wi-Fi AP mode using hostapd. Connect STA to external AP Connect AP to external STA Start ping  Wi-Fi Basic Hands-on Demo Guide  Community Support If you have questions regarding this training, please leave your comments in our Wireless MCU Community! here 
View full article
FRDM Training and Resources This article provide a guide of available resources for FRDM Development boards to help you to find and use available resources (Boards, Guides, Hands-On Trainings and more)
View full article
FRDM-IMX93 development boards are the first FRDM development board with i.MX MPUs and include Wi-Fi and Bluetooth modules and support for Debian, Yocto and GoPoint which will help you to develop your industrial and IoT applications quickly with NXP's developer experience.   FRDM-IMX93 Applications Low-cost development board usage, Bi-annual BSP release for Debian Yearly BSP release for Yocto.   Get to know FRDM-IMX 93 Development Board       Specifications 2x Arm Cortex®-A55 + Cortex®-M33 Wi-Fi 6 + BT + 802.15.4 Module on-board, IW612 2x GB Ethernet (1xETER, 1xTSN) MIPI-CSI/DSI, HDMI M.2 Connector LPDDR4X 16-bit 2GB eMMC 5.1, 32GB MicroSD 3.0 card slot 3x USB 2.0 Type-C connector (one for Debug, one PD only) + 1x USB 2.0 Type-A RTC, Buttons and LED     Feature FRDM-IMX93 eMMC 32GB DRAM Micron 2GB PMIC PCA9451A WiFi Module u-blox MAYA-W276 on-board USB TYPE C Type-C+Type-A ENET 2xGbE M.2 (Key E) SDIO WiFi / BT Y (rework needed) HDMI IT6263/Y MIPI DSI Panel 22 Pins FPC HDR LVDS Panel N MIPI CSI camera 22 Pins FPC HDR 2x20 Expansion Interface Y CAN BUS Y MicroSD Y UART Y Audio  MQS Remote Debug N NXP Connector (CAN,ADC, I2C) Y Power Connector Type-C PCB layers 10 Base Board DIM 6.5x10.5cm   NXP Devices On-Board PMIC PCA9451A USB PD TCPC PHY IC PTN5110 High-Voltage USB PD Power Switch NX20P5090UK IIC  Extends  GPIO PCAL6524/PCAL6408A CAN Transceiver TJA1051T/3 USB Sink & Source combo power switch  NX20P3483UK USB Type-C CC and SBU Protection IC  NX20P0407 Real-time clock/calendar PCF2131 Wi-Fi, BT, 802.15.4 Tri-Radio IW612 (in u-blox Module)   Expansion Boards   RPI-CAM-MIPI: IAS camera to 22 Pins FPC camera adapter TM050RDH03-41: LCD display module 5” TFT 800X480, RGB, 120.7 mm x75.8 mm7inch Waveshare 7'' DSI LCD: (English language link) 7inch Capacitive Touch, 1024×600 MX93AUD-HAT: Audio expansion board with multiple features ​8MIC-RPI-MX8: 8-microphone array proto board for voice enablement   FRDM-IMX93 web page Getting Started Guide Out of the Box Get Software Build and Run Developer Experience   Projects and Tutorials Debug Terminal in Linux & Windows Cortex-M33 Enablement Deploy ML models on NPU Graphics Security and Integrity Fast Boot Trainings   FRDM-IMX93 Web Page Training. Recorded video trainings  Generic FRDM-IMX93 SW Release Package FRDM-IMX93 Board Flashing Guide How to use J-link on FRDM-IMX93 Software and Enablement GoPoint Demo On FRDM-IMX93 Connectivity FRDM-IMX93 Connectivity training FRDM-IMX93 Connectivity WiFi Basic Hands-on FRDM-IMX93 Bluetooth A2DP Source and Sink Profile Demo FRDM-IMX93 Connectivity OpenThread Hands-on FRDM-IMX93 Connectivity WiFi Bluetooth and OT COEX ML / IA eIQ Toolkit Import NVIDIA TAO model and run on FRDM i.MX93 and i.MX93EVK   Documentation  −FRDM-IMX93 Quick Start Guide −FRDM-IMX93 Board User Manual -FRDM-IMX93 Software User Guide   Useful Links i.MX Yocto Project User’s Guide​ i.MX Linux User’s Guide i.MX Linux Reference Manual​ i.MX Porting Guide i.MX Debian Linux SDK User Guide Run Zephyr on A55 with FRDM-IMX93 and FRDM-IMX91 i.MX 93 Memory Compatibility Guide
View full article
Introduction   This hands-on video explains how to take a trained AI model and deploy it for NPU-accelerated inference using eIQ Neutron on the FRDM i.MX 95 PRO development board. YOLOv8n is used as the example model. The video covers the complete workflow, including host setup, model export, calibration, INT8 quantization, Neutron compilation, board deployment, benchmarking, and troubleshooting. By the End of This Training, You Will Be Able To Understand the main components of the eIQ Neutron-S hardware and software stack. Download and export a YOLOv8n model to TFLite. Quantize the model to INT8 for Neutron NPU execution. Compile the quantized model for the i.MX 95 target. Review compiler statistics and determine which operations are delegated to the NPU. Deploy the model, delegate, driver, and firmware to the board. Run CPU and NPU benchmarks. Compare inference latency and calculate the NPU speed-up.   Hardware and Prerequisites   Before starting the training, verify that you have the required development board, host system, network connection, model, calibration data, and software tools. Development Board   FRDM i.MX 95 PRO development board. NXP BSP LF6.18.20 2.0.0. eIQ Neutron runtime compatible with Neutron SDK 3.2.1 or later. TensorFlow Lite 2.19.0 benchmark application. Ethernet or USB-CDC connectivity. SSH and SCP access to the board. Root access on the target system. Linux Host Computer   Ubuntu 20.04 or Ubuntu 22.04 is recommended. Python 3.8 or later. Python virtual environment support. SSH and SCP command-line tools. Sufficient storage for the SDK, models, calibration images, and generated artifacts.     Watch the Complete Training Video   Watch the video from beginning to end and execute the commands in the presented order. Each stage generates an artifact required by the next stage.     Command Cheat Sheet   The following commands are organized in execution order. Replace placeholders such as <board-ip> with the values for your environment. 1. Download and Configure the Neutron SDK   # Extract the SDK archive unzip eiq-neutron-sdk-linux-3.2.1.zip # Enter the SDK directory cd eiq-neutron-sdk-linux-3.2.1 # Add the SDK tools to PATH for the current terminal export PATH="$PWD/bin:$PATH" # Optional: make the PATH configuration persistent echo 'export PATH="/path/to/eiq-neutron-sdk-linux-3.2.1/bin:$PATH"' >> ~/.bashrc # Reload the shell configuration source ~/.bashrc # Verify the SDK tools tflite-profiler --help tflite-quantizer --help neutron-compiler --help   2. Create the Python Environment   # Create a Python virtual environment python3 -m venv .venv # Activate the virtual environment source .venv/bin/activate # Upgrade pip python3 -m pip install --upgrade pip # Install the required packages pip install generate-parameter-library-py \ ultralytics \ hf \ ai-edge-litert \ litert_torch \ numpy \ opencv-python   3. Download the YOLOv8n Model   # Download the trained YOLOv8n weights hf download Ultralytics/YOLOv8 yolov8n.pt --local-dir . # Verify the downloaded model ls -lh yolov8n.pt   4. Export YOLOv8n to TFLite   # Export the PyTorch model to TFLite yolo export model=yolov8n.pt format=tflite # Locate the generated TFLite model find . -name "*.tflite" -type f # Update the following commands if your exported # model uses a different file name or directory.   5. Download the COCO Calibration Dataset   # Create a directory for the calibration dataset mkdir -p coco cd coco # Download the COCO training images wget --no-check-certificate \ http://images.cocodataset.org/zips/train2017.zip # Extract the images unzip train2017.zip # Return to the project directory cd .. # Verify the image directory find ./coco/train2017 -type f -name "*.jpg" | head   6. Create the Calibration Conversion Script   Save the following script as jpg2bin.py . It converts the JPEG calibration images into raw binary tensors expected by the profiler. #!/usr/bin/env python3 import argparse import glob import os import random import cv2 import numpy as np def letterbox(image, new_shape=640, color=(114, 114, 114)): height, width = image.shape[:2] ratio = min(new_shape / height, new_shape / width) resized_height = int(round(height * ratio)) resized_width = int(round(width * ratio)) resized = cv2.resize( image, (resized_width, resized_height), interpolation=cv2.INTER_LINEAR, ) canvas = np.full( (new_shape, new_shape, 3), color, dtype=np.uint8, ) top = (new_shape - resized_height) // 2 left = (new_shape - resized_width) // 2 canvas[ top:top + resized_height, left:left + resized_width, ] = resized return canvas def main(): parser = argparse.ArgumentParser( description="Convert JPEG images to YOLOv8n calibration tensors." ) parser.add_argument( "--images", default="./coco/train2017", help="Directory containing the calibration JPEG images.", ) parser.add_argument( "--out", default="./calib_yolov8n", help="Output directory for the binary tensors.", ) parser.add_argument( "--num", type=int, default=1000, help="Maximum number of calibration images.", ) parser.add_argument( "--size", type=int, default=640, help="Model input width and height.", ) parser.add_argument( "--shuffle", action="store_true", help="Shuffle the image list before selecting images.", ) args = parser.parse_args() os.makedirs(args.out, exist_ok=True) files = sorted( glob.glob(os.path.join(args.images, "*.jpg")) ) if args.shuffle: random.seed(0) random.shuffle(files) files = files[:args.num] if not files: raise RuntimeError( f"No JPEG images were found in {args.images}" ) for index, file_path in enumerate(files): image = cv2.imread(file_path) if image is None: print(f"Skipping unreadable image: {file_path}") continue # Convert BGR to RGB. image = cv2.cvtColor(image, cv2.COLOR_BGR2RGB) # Letterbox resize to 640 x 640. image = letterbox(image, args.size) # Convert to float32 and normalize to [0, 1]. tensor = image.astype(np.float32) / 255.0 # Add batch dimension. # Final layout: 1 x 640 x 640 x 3, NHWC. tensor = np.expand_dims(tensor, axis=0) output_path = os.path.join( args.out, f"calib_{index:05d}.bin", ) tensor.tofile(output_path) print( f"Calibration tensors written to: {args.out}" ) if __name__ == "__main__": main() # Make the script executable chmod +x jpg2bin.py # Generate up to 1000 calibration tensors python3 jpg2bin.py \ --images ./coco/train2017 \ --out ./calib_yolov8n \ --num 1000 \ --size 640 \ --shuffle # Count the generated binary files find ./calib_yolov8n -type f -name "*.bin" | wc -l # Check the size of a generated tensor ls -lh ./calib_yolov8n | head   7. Inspect the TFLite Input and Output Tensors   python3 - <<'PY' from ai_edge_litert.interpreter import Interpreter model_path = "yolov8n.tflite" interpreter = Interpreter(model_path=model_path) interpreter.allocate_tensors() print("Input details:") for tensor in interpreter.get_input_details(): print(tensor) print("\nOutput details:") for tensor in interpreter.get_output_details(): print(tensor) PY Record the exact input tensor name reported by the model. Replace serving_default_args_0 in the profiling command if your model uses a different name.   8. Profile the Floating-Point TFLite Model   # Replace serving_default_args_0 if the model # reports a different input tensor name. tflite-profiler \ --input yolov8n.tflite \ --dataset serving_default_args_0,calib_yolov8n \ --output yolov8n_profile.csv # Verify that the profiling CSV was generated ls -lh yolov8n_profile.csv # Preview the beginning of the profile head yolov8n_profile.csv   9. Quantize the Model to INT8   # Generate the INT8 TFLite model tflite-quantizer \ --input yolov8n.tflite \ --profile yolov8n_profile.csv \ --output yolov8n_quant.tflite # Compare the model file sizes ls -lh yolov8n.tflite yolov8n_quant.tflite   10. Verify the Quantized Model   python3 - <<'PY' from ai_edge_litert.interpreter import Interpreter model_path = "yolov8n_quant.tflite" interpreter = Interpreter(model_path=model_path) interpreter.allocate_tensors() print("Quantized input details:") for tensor in interpreter.get_input_details(): print("Name:", tensor["name"]) print("Shape:", tensor["shape"]) print("Data type:", tensor["dtype"]) print("Quantization:", tensor["quantization"]) print() print("Quantized output details:") for tensor in interpreter.get_output_details(): print("Name:", tensor["name"]) print("Shape:", tensor["shape"]) print("Data type:", tensor["dtype"]) print("Quantization:", tensor["quantization"]) print() PY   11. Compile the Model for the Neutron NPU   # Compile the INT8 model for the i.MX 95 Neutron NPU neutron-compiler \ --input yolov8n_quant.tflite \ --output yolov8n_neutron.tflite \ --target imx95 # Verify the generated model ls -lh yolov8n_neutron.tflite Generate Compiler Statistics # Generate compiler and delegation statistics neutron-compiler \ --input yolov8n_quant.tflite \ --output yolov8n_neutron_stats.tflite \ --target imx95 \ --dump-statistics # Review the compiler output and record: # 1. Number of delegated nodes # 2. Number of CPU fallback nodes # 3. Unsupported operators # 4. Generated NeutronGraph partitions Create a Profiling Build # Compile a profiling-enabled model neutron-compiler \ --input yolov8n_quant.tflite \ --output yolov8n_neutron_prof.tflite \ --target imx95 \ --use-profiling # Verify all generated models ls -lh yolov8n_quant.tflite \ yolov8n_neutron.tflite \ yolov8n_neutron_prof.tflite   12. Configure the Board IP Address   # Replace the example address with the board IP address export BOARD_IP="192.168.1.100" # Verify network connectivity ping -c 4 "$BOARD_IP" # Test the SSH connection ssh root@"$BOARD_IP"   13. Create the Deployment Directory   # Create the working directory remotely ssh root@"$BOARD_IP" \ "mkdir -p /root/neutron_demo"   14. Copy Runtime Artifacts to the Board   The driver, delegate, and firmware may already be included in the BSP. Copy them only when the required or matching versions are not already installed. # Copy the Neutron driver scp libNeutronDriver.so \ root@"$BOARD_IP":/lib/ # Copy the Neutron delegate scp libneutron_delegate.so \ root@"$BOARD_IP":/usr/lib/ # Copy the Neutron firmware scp NeutronFirmware.elf \ root@"$BOARD_IP":/lib/firmware/ # Copy the plain INT8 model for the CPU baseline scp yolov8n_quant.tflite \ root@"$BOARD_IP":/root/neutron_demo/ # Copy the Neutron-compiled model scp yolov8n_neutron.tflite \ root@"$BOARD_IP":/root/neutron_demo/ # Optional: copy the profiling-enabled model scp yolov8n_neutron_prof.tflite \ root@"$BOARD_IP":/root/neutron_demo/   15. Verify the Files on the Board   # Connect to the board ssh root@"$BOARD_IP" # Enter the deployment directory cd /root/neutron_demo # Verify the models ls -lh /root/neutron_demo/ # Check the driver ls -lh /lib/libNeutronDriver.so # Check the delegate ls -lh /usr/lib/libneutron_delegate.so # Check the firmware ls -lh /lib/firmware/NeutronFirmware.elf # Refresh the shared-library cache ldconfig # Verify that the delegate is visible to the loader ldconfig -p | grep -i neutron   16. Check the BSP and Runtime Environment   # Display the Linux distribution and BSP information cat /etc/os-release # Display the kernel version uname -a # Search for Neutron-related kernel messages dmesg | grep -i neutron # Search for firmware-related messages dmesg | grep -i firmware # Locate the TensorFlow Lite benchmark application find /usr/bin -name "benchmark_model*" -type f 2>/dev/null   17. Run the CPU Baseline   cd /root/neutron_demo /usr/bin/tensorflow-lite-2.19.0/examples/benchmark_model \ --graph=yolov8n_quant.tflite \ --num_threads=4 \ --num_runs=50 Record the average inference latency, minimum latency, maximum latency, initialization time, and memory information reported by the benchmark.   18. Run the NPU Benchmark   cd /root/neutron_demo /usr/bin/tensorflow-lite-2.19.0/examples/benchmark_model \ --graph=yolov8n_neutron.tflite \ --external_delegate_path=/usr/lib/libneutron_delegate.so \ --num_runs=50 Confirm that the benchmark output reports that the external delegate was loaded and that one or more model partitions were delegated.   19. Save Benchmark Results   # Save the CPU benchmark output /usr/bin/tensorflow-lite-2.19.0/examples/benchmark_model \ --graph=yolov8n_quant.tflite \ --num_threads=4 \ --num_runs=50 \ 2>&1 | tee cpu_benchmark.txt # Save the NPU benchmark output /usr/bin/tensorflow-lite-2.19.0/examples/benchmark_model \ --graph=yolov8n_neutron.tflite \ --external_delegate_path=/usr/lib/libneutron_delegate.so \ --num_runs=50 \ 2>&1 | tee npu_benchmark.txt # Review the saved results cat cpu_benchmark.txt cat npu_benchmark.txt   20. Calculate the NPU Speed-Up   Use the average latency reported by each benchmark: Speed-up = CPU average latency / NPU average latency Example: CPU average latency = 100 ms NPU average latency = 10 ms Speed-up = 100 / 10 Speed-up = 10x     Required Deployment Artifacts   Artifact Example File Purpose Neutron driver libNeutronDriver.so Communicates with the Neutron firmware and passes model buffers, weights, kernels, and input or output data. Neutron delegate libneutron_delegate.so Connects TensorFlow Lite to the Neutron runtime and delegates supported NeutronGraph operations to the NPU. Neutron firmware NeutronFirmware.elf Runs on the dedicated RISC-V core and executes the generated Neutron microcode. Quantized TFLite model yolov8n_quant.tflite Provides the CPU baseline and serves as the input to the Neutron compiler. Neutron-compiled model yolov8n_neutron.tflite Contains NeutronGraph operations generated for NPU execution.   Troubleshooting   Use the following table to identify common host, model, compilation, deployment, and runtime problems. Area Problem Possible Cause Recommended Solution Host setup SDK commands are not found. The SDK bin directory is not included in PATH . Run export PATH="$PWD/bin:$PATH" from the SDK directory. Add the absolute SDK path to ~/.bashrc if the configuration must persist. Python environment A required Python module cannot be imported. The virtual environment is not active or the package was installed in a different environment. Run source .venv/bin/activate . Verify the active interpreter with which python3 , and reinstall the missing dependency with pip install PACKAGE_NAME . Model export The expected yolov8n.tflite file cannot be found. The exporter created a subdirectory or used a different filename. Run find . -name "*.tflite" -type f . Update the following commands to use the actual exported model path. Calibration No calibration binary files are generated. The image directory is incorrect or does not contain JPEG files. Verify the directory with find ./coco/train2017 -name "*.jpg" | head . Pass the correct directory through the --images argument. Calibration The calibration tensor has the wrong shape or size. The resize, batch dimension, layout, or data type is incorrect. Confirm an NHWC tensor with shape 1 x 640 x 640 x 3 , RGB channel order, float32 data, and values normalized to [0, 1] . Calibration The quantized model produces inaccurate predictions. The calibration preprocessing differs from inference preprocessing. Verify letterbox resizing, padding color, RGB conversion, normalization, tensor layout, input size, and data type. Use representative images that match the intended application. Profiler The profiler reports an invalid or unknown input tensor. The tensor name in --dataset does not match the model input name. Inspect the model input details with the TFLite interpreter. Replace serving_default_args_0 with the exact name reported by the model. Profiler The profiler cannot read the calibration files. The dataset path is incorrect, the folder is empty, or the binary format does not match the input tensor. Verify the folder path, count the files, and confirm the expected number of bytes for each tensor. Quantization The quantized model still uses floating-point tensors. The model was not fully quantized or the generated profile is incomplete. Re-run profiling with valid calibration data. Inspect the input, output, and intermediate tensor data types before compiling the model. Compilation neutron-compiler fails. The input model is invalid, not INT8, or contains unsupported quantization parameters. Confirm that the input is the quantized TFLite model. Inspect its tensor types and quantization parameters, then run the compiler again with statistics enabled.   Conclusion   Congratulations! You have completed the end-to-end workflow for deploying and running an AI model on the eIQ Neutron-S NPU integrated into the FRDM i.MX 95 PRO. Throughout this training, you learned how to prepare the Linux host environment, export YOLOv8n to TFLite, build a representative calibration dataset, quantize the model to INT8, and compile it for the i.MX 95 target. You also learned how to transfer the required runtime artifacts to the board and compare CPU and NPU inference performance. This workflow is not limited to YOLOv8n. You can use the same process as a starting point for deploying your own computer vision models. However, each model must be evaluated individually because input formats, preprocessing requirements, quantization behavior, and operator support may differ. Recommended Next Steps   Validate the accuracy of the INT8 model against the original floating-point model. Review the compiler statistics to identify unsupported operations and CPU fallback sections. Measure end-to-end application performance, including preprocessing, inference, and post-processing. Test the workflow with your own model and a calibration dataset that represents your real application. Use a profiling-enabled build to identify the most expensive layers and potential performance bottlenecks.
View full article
  Introduction   This hands-on walks you through everything that happens before you ever write a line of application code: unboxing your FRDM i.MX 95 Pro board, getting acquainted with its layout and ports, powering it on, and confirming a healthy first boot from the on-board eMMC. By the time you are done, you will be comfortable using both the i.MX System Manager console and the Linux command line to confirm exactly what hardware you have in front of you. By the end you will be able to: Verify that the contents of your FRDM i.MX 95 Pro box are complete Get acquainted with the board, its peripherals, and ports Set up and boot the board for the first time Get familiar with the i.MX System Manager (SM) console and the Linux CLI Verify the board's hardware and resources using Linux commands Hardware & Prerequisites You need very little to get started: FRDM-IMX95-PRO board (the box) — in addition to the board itself, the box includes USB-C cables for power and debugging, mounting standoffs, the IW612 wireless module, and a documentation card linking to the product page and a getting-started tutorial. Power supply — a USB-C to USB-C cable is included in the box. For basic bring-up, any standard USB-C phone charger is sufficient. If your setup adds higher-power accessories (e.g., a display), use a 100 W-capable USB-C power adapter instead. PC host — a computer with a terminal / serial console program to connect to the board's debug port. That's it — no display or camera is required for this hands-on. Watch the Module Video Watch the full hands-on walkthrough below, then follow along on your own board.   Steps to Run the Hands-On Step 1: Explore the Board with Linux Commands Once the board has booted, open a terminal on the debug console and run the following commands to confirm the Linux environment and the hardware resources available to you. # 1) Linux version uname -a # 2) Storage devices lsblk # 3) Verify CPU numbers and architecture. lscpu # 4) SoC Id and Family cat /sys/devices/soc0/soc_id cat /sys/devices/soc0/family # 5) RAM memory available cat /proc/meminfo | head -20 # 6) network peripherals and addresses ip addr # 7) List Video Encoders and Decoders v4l2-ctl --list-devices # 8) GPU specs and capabilities vulkaninfo --summary # 9) Print available GPIOs gpioinfo Step 2: Explore the i.MX System Manager Console Next, switch to the i.MX System Manager (SM) console to inspect the board at the system level — Logical Machines, boot times, power rails, and clocks. # 1) System manager version, Board, Revision, Silicon etc info # 2) Logical Machines information lm info # 3) Boot time of each Logical machine btime # 4) Power status of each peripheral power.r # 5) Clocks status clock.r Troubleshooting Symptom What to check Power LED is on but there is no output on the console Check the Boot Mode switches (set them to eMMC) Power-cycle the board (turn it off and back on) after changing the Boot Mode switches Verify the serial console baud rate is set to 115200 Confirm the Debug port is connected to the host PC Open all the COM ports exposed by the board when the Debug port is connected to the host PC Conclusion In this hands-on, you: Verified the contents of your FRDM i.MX 95 Pro box Got acquainted with the board, its peripherals, and ports Set up and booted the board for the first time from eMMC Used the i.MX System Manager console and the Linux CLI to inspect the board Confirmed the board's hardware and resources via Linux commands If you have not already, watch the module video above for the full walkthrough, and check out the rest of the FRDM Training Hub for the next hands-on in the series.
View full article
  FRDM i.MX 95 Pro · Hands-On Series GoPoint — Running Pre-Built Demos September 2026  |  FRDM i.MX 95 Pro Hands-On Series   Introduction Discover what your FRDM i.MX 95 Pro can do — right out of the box. This hands-on walks you through the full range of pre-built demo categories available through GoPoint on the FRDM i.MX 95 Pro board. From neural processing and machine learning to GPU-accelerated graphics, each demo showcases the real-world capabilities of NXP's i.MX 95 application processor — no custom code required. The hands-on covers the following topics: Launching GoPoint on the Weston desktop Exploring the available demo categories (NPU, ML, GPU) Running NPU demos with the Ara240 module Running ML and GPU demos By the end of this hands-on, you will be able to: Navigate the GoPoint interface on Weston Identify the available demo categories (NPU, ML, and GPU) Launch and run pre-built demos on your FRDM i.MX 95 Pro board Understand the hardware requirements for each demo type   Hardware & Prerequisites Before starting, make sure you have the following items ready: Required Hardware FRDM-IMX95-PRO board (booted from eMMC) HDMI display Mouse Keyboard USB camera Ara240 module (required for NPU demos) Optional Hardware EXPI-OS08A20 camera module — covered in the separate EXPI-OS08A20 Camera + ISP Pipeline hands-on Note: The board must be booted from eMMC with the pre-loaded BSP image before launching GoPoint. Ensure your display is connected via HDMI before powering on.   Watch the Hands-On Video A complete video walkthrough accompanies this hands-on. It demonstrates every step shown below — from opening GoPoint on Weston to running NPU, ML, and GPU demos live on the board. Watch it alongside the written steps for the best learning experience.   Steps to Run the Hands-On Follow the steps below to explore GoPoint and run the pre-built demos on your board. Step 1 — Launch GoPoint on Weston After the board boots into the Weston desktop environment, locate the GoPoint application icon on the desktop or in the application launcher. Click it to open the GoPoint demo browser. GoPoint provides a graphical interface that organises all available demos by category, making it easy to browse and launch them without any command-line interaction. Step 2 — Explore the Demo Categories Once GoPoint is open, you will see the main demo category tiles. The three primary categories available on the FRDM i.MX 95 Pro are: NPU Demos — Neural Processing Unit demos that leverage the Ara240 module for hardware-accelerated AI inference ML Demos — Machine learning demos running on the i.MX 95 application processor GPU Demos — Graphics Processing Unit demos showcasing GPU-accelerated rendering and compute Browse each category to see the individual demos available. Each demo tile shows its name, a brief description, and any special hardware it requires. Step 3 — Run NPU Demos (Ara240 Required) NPU demos require the Ara240 module to be attached to the board. Select any NPU demo from the GoPoint interface and click Run. GoPoint will automatically load the required AI model and launch the demo. The Ara240 module handles the neural network inference, delivering real-time results on-screen. Note: If AI/ML models are not yet present on the board, run the fetch_models command first (see the Troubleshooting section below). Step 4 — Run ML Demos ML demos run directly on the i.MX 95 application processor and do not require the Ara240 module. Select an ML demo from the GoPoint interface and click Run. These demos cover a range of machine learning use cases including image classification, object detection, and more. Step 5 — Run GPU Demos GPU demos showcase the graphics and compute capabilities of the i.MX 95's integrated GPU. Select a GPU demo from the GoPoint interface and click Run. These demos include GPU-accelerated graphics rendering and visual effects that highlight the board's multimedia performance.   Troubleshooting If you encounter issues while running GoPoint demos, use the table below to identify the symptom and the recommended action. Symptom What to Check Missing AI/ML models — demo fails to start or reports missing model files Fetch the required models using the commands below. Use --list to see available models and --repo-id to fetch a specific one: # List available models fetch_models --list # Fetch a specific model by repository ID fetch_models --repo-id Cannot download software requirements — network or SSL errors during model download The board's system clock may be incorrect, causing certificate validation to fail. Set the correct date and time, then retry: # Set the system date (replace with current date/time) date -s "MM/DD/YYYY HH:MM:SS" Board freeze — the board becomes unresponsive during a demo Reboot the board: reboot Corrupt download — a demo crashes immediately or shows unexpected errors after model download Remove the Python virtual environment ( venv ) for the affected demo and re-run it so GoPoint recreates a clean environment. The venv directory is located inside the demo's working folder. # Remove the venv of the corresponding demo, then relaunch it from GoPoint   Conclusion In this hands-on you explored the GoPoint application on the FRDM i.MX 95 Pro board and ran pre-built demos across three hardware-accelerated categories: Launched and navigated the GoPoint interface on the Weston desktop Ran NPU demos using the Ara240 neural processing module Ran ML demos on the i.MX 95 application processor Ran GPU demos showcasing the board's graphics capabilities Learned how to fetch AI/ML models and resolve common setup issues For a full visual walkthrough, watch the video in the Watch the Hands-On Video section above. To continue your learning journey, visit the FRDM i.MX 95 Pro Training Hub for the complete series of hands-on modules covering camera pipelines, connectivity, security, and more.
View full article
FRDM i.MX 95 Pro Hands-On: ARA240 DNPU AI Accelerator FRDM i.MX 95 Pro Hands-On Training Series  |  September 2026   Introduction This hands-on walks you through the ARA240 DNPU AI Accelerator integrated with the FRDM i.MX 95 Pro development board. The ARA240 is an M.2-form-factor neural processing unit that connects over PCIe and dramatically expands the board's AI inference capability — from classic computer-vision pipelines to large language models (LLMs) and vision-language models (VLMs) — all powered by NXP's eIQ software stack.   Item Details Host Board FRDM i.MX 95 Pro AI Accelerator ARA240 DNPU (up to 2 modules) BSP L6.18.20-2.0.0 (precompiled, available on the NXP website) Interface PCIe via M.2 Key-M slots J24 / J25   By the end of this hands-on you will be able to: Verify that the ARA240 DNPU is correctly detected by the system. List, download, and run AI models (CNN, LLM, VLM) on the accelerator. Measure DNPU performance metrics using the provided shell utilities. Configure and start the eIQ AAF Connector service to expose a REST API for AI inference. Send chat-completion requests to a locally running LLM through the connector's web interface. Troubleshoot the most common setup issues.   Hardware & Prerequisites Gather the following before starting: Hardware FRDM-IMX95-PRO development board ARA240 DNPU module (one or two, depending on your use case) Keyboard (for direct board interaction) Host machine with a web browser (to access the connector API UI) Internet connection (required for model downloads) M.2 Connector Reference Connector Purpose J24 M.2 Key-M slot — ARA240 Module #1 J25 M.2 Key-M slot — ARA240 Module #2 J9 Fan power supply for the module in J24 J10 Fan power supply for the module in J25 Software BSP L6.18.20-2.0.0 — precompiled image available on the NXP website.   Watch the Hands-On Video The video below walks through the complete ARA240 DNPU setup and demo flow on the FRDM i.MX 95 Pro, covering device detection, model download, inference testing, NPU metrics, and the eIQ AAF Connector in action. Watch it alongside the step-by-step instructions in the next section.   Steps to Run the Hands-On All commands below are run directly on the FRDM i.MX 95 Pro board (via serial console or SSH). The eIQ utilities are pre-installed in the BSP image. Step 1 — Verify Device Detection After powering on the board with the ARA240 module seated in J24 (and/or J25), confirm the accelerator is recognized by the system: # Device Detection & Status chip_info.sh The script prints the detected DNPU chip information. If nothing is returned, check the M.2 seating and fan-power connectors (J9/J10). Step 2 — List Available Models Use the fetch_models utility to see which AI models are available for download: # List available models fetch_models --list The output shows model IDs for CNN, LLM, and VLM workloads that are compatible with the ARA240. Step 3 — Download a Model Download a model by its repository ID. The example below fetches a 7-billion-parameter instruction-tuned LLM: # Download a specific model (example: Qwen2.5 7B) fetch_models --repo-id nxp/Qwen2.5-7B-Instruct-Ara240 Models are stored under /usr/share/ in subdirectories named cnn , llm , or vlm depending on the model type. Step 4 — Run Inference Performance Tests Once a model is downloaded, benchmark its inference performance on the DNPU: # Running Inference Tests run_model_perf.sh Step 5 — Measure DNPU Metrics Capture real-time NPU utilization and performance counters: # Measuring DNPU Metrics ara2_metrics.sh Step 6 — Configure and Start the eIQ AAF Connector The eIQ AAF Connector exposes a REST API (OpenAI-compatible) so any HTTP client or web application can send inference requests to the ARA240. Follow these steps: # Check whether the connector service is already running systemctl status eiq-aaf-connector.service # Start the connector service (systemd-managed) systemctl start eiq-aaf-connector.service # Stop the connector service when done systemctl stop eiq-aaf-connector.service # Edit the connector configuration (model path, port, etc.) vi /usr/share/eiq/aaf-connector/server_config.json # Alternatively, start the connector manually (foreground) /usr/share/eiq/aaf-connector/venv/bin/connector --host 0.0.0.0 --port 8000 Once the connector is running, open the interactive API documentation in a browser on your host machine (replace <board-ip> with the board's actual IP address): # Open the connector Web API interface in a browser http://<board-ip>:8000/docs Step 7 — Send a Chat Completion Request With the connector running and a downloaded LLM, you can send an OpenAI-compatible chat completion request directly from the API docs page or via any HTTP client: # Example chat completion payload (POST to /v1/chat/completions) { "model": "Qwen2.5-7B-Instruct", "messages": [ { "role": "system", "content": "You are a helpful assistant" }, { "role": "user", "content": "hello, how are you?" } ] }   Troubleshooting Symptom What to Check chip_info.sh returns nothing / DNPU not detected Verify the ARA240 module is firmly seated in J24 or J25. Confirm the fan-power cable is connected to J9 (for J24) or J10 (for J25). Reboot the board after reseating. fetch_models --list fails or model download hangs Check internet connectivity: ping 8.8.8.8 If DNS resolution fails, set it manually: echo nameserver 8.8.8.8 > /etc/resolv.conf Model not found after download Verify the model landed in the correct directory: ls /usr/share/<cnn|llm|vlm>/ Certificate or TLS errors during model download The board's system clock may be wrong. Set the correct date and time: date --set="18 SEP 2026 13:00:00" Then retry the download. Connector service fails to start Check journalctl -u eiq-aaf-connector.service for error details. Ensure server_config.json points to a valid downloaded model path.   Conclusion In this hands-on you: Connected the ARA240 DNPU AI Accelerator to the FRDM i.MX 95 Pro via PCIe (M.2 Key-M). Verified device detection and explored available AI models using the eIQ command-line utilities. Downloaded and benchmarked a large language model on the DNPU. Measured real-time NPU performance metrics with ara2_metrics.sh . Configured and launched the eIQ AAF Connector to expose an OpenAI-compatible REST API. Sent a live chat-completion request to a locally running LLM — entirely on the edge. For a full visual walkthrough, watch the demo video above. Explore the rest of the FRDM i.MX 95 Pro Hands-On Training Hub for additional modules covering cameras, connectivity, multimedia, and more.
View full article
This MCXW72 training video talk about the Lifecycle state model, explain in detail the purpose, and security recommendations for each state.  Training shows the fuses involved in this process to advance lifecycle and enable the basic security features like Secure Boot and Secure Debug. Video also includes examples about how to use MCUXpresso Secure Provisioning Tool (SEC) to create Root of Trust Key Hash (RoTKTH) and SB3KDK Encryption key as well as hoe to active debug authentication before to move Lifecycle states.
View full article
Unlike MCXW 71 MCU, MCXW 72 supports an Open NBU. This means that NBU firmware source code is exposed to user. On MCXW 71 MCU, NBU firmware is NXP proprietary; it is not user customizable.
View full article
This document is intended to guide you in the installation of the necessary tools and repository for start running Zephyr examples and development. Zephyr is a lightweight, open-source real-time operating system (RTOS) designed specifically for microcontrollers (MCUs) and other resource-constrained embedded devices. Unlike general-purpose operating systems, Zephyr is built to run on systems with limited memory, low power consumption, and strict real-time requirements. It provides the core software foundation that allows an MCU to run multiple tasks reliably, respond to events on time, and interact with hardware in a structured way.
View full article
This document is intended to guide you in the installation of the necessary tools and repository for start running matter examples and development. Matter (previously known as Project CHIP) is a single, unified, application-layer connectivity standard designed to enable developers to connect and build reliable, secure IoT ecosystems and increase compatibility among Smart Home and Building devices. Backed by major brands and developed through collaboration within the Connectivity Standards Alliance (previously known as the Zigbee Alliance), Matter is an open-source royalty-free connectivity standard built with market-proven technologies using Internet Protocol (IP) and compatible with Thread and Wi-Fi network transports. Building solutions and leading standards efforts, NXP provides scalable, flexible and secure platforms for the variety of use cases Matter addresses – from end nodes to gateways – so device manufacturers can focus on their product innovation. NXP’s Matter solutions go beyond just the connectivity with comprehensive capabilities for the compute and security requirements for IoT devices.
View full article
Goal of this lab is to show the SDK example implementing the Bluetooth LE Ranging profile, how to flash it and run it, as well as looking into the code to extract meaningful information for applications that use ranging Guide
View full article
This document is intended to guide you in the installation of the tools and let you know the material required for the FRDM-MCXW72 Channel Sounding Hands On 
View full article
In this lab we make some experience with the FRDM-MCXW72 board using the SDK project to implement a simple LED blinking. Once we will get familiar with the example project, we will integrate simple modifications
View full article
In this lab we will first import the MCUXpresso SDK for the MCX W72 Freedom board into MCUXpresso IDE and then we will build, flash and debug the hello world project to make sure the environment is set for the following Labs  
View full article
This hands-on describes how to run the Low Power Reference Design demo on FRDM-MCXW72. Two low-power reference design applications are provided in the reference_design folder: Low power peripheral application, demonstrating the low power feature on an advertiser peripheral Bluetooth LE device. Low power central application, demonstrating the low power feature on a scanner central Bluetooth LE device. These applications aim at providing: A reference design application for low power/timing optimization on a Bluetooth Low Energy application. These can be used in first intent for porting a new application on low power. A way for measuring the power consumption, wake-up time, and active time in various power modes. The default low-power mode used in different modes are shown as follows: Default power mode App core Radio core Advertise mode Power Down mode Deep sleep mode Connected mode Deep Sleep mode Deep Sleep mode Scanning mode Deep Sleep mode WFI or Deep Sleep mode For complete documentation please visit: reference_design — MCUXpresso SDK Documentation
View full article
Goal of this lab is to show the SDK example implementing the wireless UART profile and we will move forward in making some meaningful modifications to the example itself with the goal to show where in the code the end user should enter the relevant application software for the application. Run Wireless UART IoT Toolbox Demo
View full article
The MCX W72 family features a 96 MHz Arm® Cortex®-M33 core coupled with a multiprotocol radio subsystem also called Narrow Band Unit (NBU) supporting Matter, Thread, Zigbee and Bluetooth LE. The independent radio subsystem, with a dedicated core and memory, offloads the main CPU, preserving it for the primary application and allowing firmware updates to support future wireless standards. On MCXW72, only boot ROM has access to the NBU flash. The ROM bootloader provides an in-system programming (ISP) utility that operates over a serial connection on the microcontroller units (MCUs) The objective in this hands-on, is to learn how to recognize when the NBU firmware does not match with the SDK version.
View full article
The MCX W72 family features a 96 MHz Arm® Cortex®-M33 core coupled with a multiprotocol radio subsystem also called Narrow Band Unit (NBU) supporting Matter, Thread, Zigbee and Bluetooth LE. The independent radio subsystem, with a dedicated core and memory, offloads the main CPU, preserving it for the primary application and allowing firmware updates to support future wireless standards.   The ROM bootloader provides an in-system programming (ISP) utility that operates over a serial connection on the microcontroller units (MCUs)  This hands-on describes how to update the code in NBU and the User firmware using the ISP.  
View full article