- Forums
- Product Forums
- General Purpose MicrocontrollersGeneral Purpose Microcontrollers
- i.MX Forumsi.MX Forums
- QorIQ Processing PlatformsQorIQ Processing Platforms
- Identification and SecurityIdentification and Security
- Power ManagementPower Management
- Wireless ConnectivityWireless Connectivity
- RFID / NFCRFID / NFC
- Advanced AnalogAdvanced Analog
- MCX Microcontrollers
- S32G
- S32K
- S32V
- MPC5xxx
- Other NXP Products
- S12 / MagniV Microcontrollers
- Powertrain and Electrification Analog Drivers
- Sensors
- Vybrid Processors
- Digital Signal Controllers
- 8-bit Microcontrollers
- ColdFire/68K Microcontrollers and Processors
- PowerQUICC Processors
- OSBDM and TBDML
- S32M
- S32Z/E
-
- Solution Forums
- Software Forums
- MCUXpresso Software and ToolsMCUXpresso Software and Tools
- CodeWarriorCodeWarrior
- MQX Software SolutionsMQX Software Solutions
- Model-Based Design Toolbox (MBDT)Model-Based Design Toolbox (MBDT)
- FreeMASTER
- eIQ Machine Learning Software
- Embedded Software and Tools Clinic
- S32 SDK
- S32 Design Studio
- GUI Guider
- Zephyr Project
- Voice Technology
- Application Software Packs
- Secure Provisioning SDK (SPSDK)
- Processor Expert Software
- Generative AI & LLMs
-
- Topics
- Mobile Robotics - Drones and RoversMobile Robotics - Drones and Rovers
- NXP Training ContentNXP Training Content
- University ProgramsUniversity Programs
- Rapid IoT
- NXP Designs
- SafeAssure-Community
- OSS Security & Maintenance
- Using Our Community
-
- Cloud Lab Forums
-
- Knowledge Bases
- ARM Microcontrollers
- i.MX Processors
- Identification and Security
- Model-Based Design Toolbox (MBDT)
- QorIQ Processing Platforms
- S32 Automotive Processing Platform
- Wireless Connectivity
- CodeWarrior
- MCUXpresso Suite of Software and Tools
- MQX Software Solutions
- RFID / NFC
- Advanced Analog
-
- NXP Tech Blogs
- RSS フィードを購読する
- トピックを新着としてマーク
- トピックを既読としてマーク
- このトピックを現在のユーザーにフロートします
- ブックマーク
- 購読
- ミュート
- 印刷用ページ
- 新着としてマーク
- ブックマーク
- 購読
- ミュート
- RSS フィードを購読する
- ハイライト
- 印刷
- 不適切なコンテンツを報告
Hello,
Can someone please help me with explaining the proper way to flash the code in the target device using the J-Link Debuuger device using S32 Design Studio for ARM version 2018.R1.
This is the Software default window. Can any one guide me through this
解決済! 解決策の投稿を見る。
- 新着としてマーク
- ブックマーク
- 購読
- ミュート
- RSS フィードを購読する
- ハイライト
- 印刷
- 不適切なコンテンツを報告
Hi@akhilranga
I think you are not operating the debugger correctly
1. If you don’t want to debug the code and just want to download the code to the MCU
2. If you want to disconnect the debugger, please disconnect the debugger in the following option
Please do not directly disconnect the debugger's hardware connection with the debugging interface open.
please check your J-LINK version
Segger: J-Link V9.4 and above + software J-Link V6.00d and above
- 新着としてマーク
- ブックマーク
- 購読
- ミュート
- RSS フィードを購読する
- ハイライト
- 印刷
- 不適切なコンテンツを報告
- 新着としてマーク
- ブックマーク
- 購読
- ミュート
- RSS フィードを購読する
- ハイライト
- 印刷
- 不適切なコンテンツを報告
Hi @Senlent
I usually do the same thing for debugging process. But when i want to dump the code to the board i usually open debugging window and press play
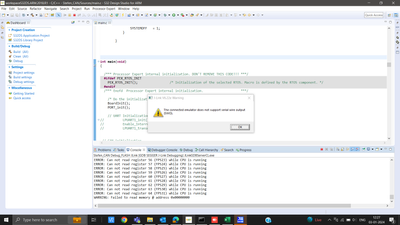
and then remove the chords of J-Link Debugger module from the board and my pc. And once i do this it gives the following pop up.
But even after this pop up the board is flashed with the code and operates normally how it is intended to. But recently i noticed a something different which is when i connect the J-link debugger and process and start the debug and press resume on the debuging window all my CAN related frames are working normally but when i remove the chord as i said earlier i started noticing some missing CAN frames. So, that is the reason i was asking you for the right way to flash the code in to the board. Can you please help me identify what is the reason of the missing CAN frames.
When the debugger is connected and when i press the resume the debugg session the CAN frames are being received with out any trouble but when i discinnect the J-Link Debugger hardware from my PC or fromt the board. I am starting miss some CAN frames. This is the issue. And from my point of i veiw i beleive the issue might be with the abrupt diconnecting of J-Link Debugger Hardware from my PC.
- 新着としてマーク
- ブックマーク
- 購読
- ミュート
- RSS フィードを購読する
- ハイライト
- 印刷
- 不適切なコンテンツを報告
Hi@akhilranga
I think you are not operating the debugger correctly
1. If you don’t want to debug the code and just want to download the code to the MCU
2. If you want to disconnect the debugger, please disconnect the debugger in the following option
Please do not directly disconnect the debugger's hardware connection with the debugging interface open.
please check your J-LINK version
Segger: J-Link V9.4 and above + software J-Link V6.00d and above
- 新着としてマーク
- ブックマーク
- 購読
- ミュート
- RSS フィードを購読する
- ハイライト
- 印刷
- 不適切なコンテンツを報告
Hi @Senlent
My software version is SEGGER J-Link GDB Server V7.94c Command Line Version
But how can i check whether my J-Link is above V9.4 and above.
I tried to perform the operartion of flashing the target MCU and disconnecting as you mentioned earlier. But my disconnect option is disabled on my software. So, i am trying to figure how can i enable that disconnect option.
- 新着としてマーク
- ブックマーク
- 購読
- ミュート
- RSS フィードを購読する
- ハイライト
- 印刷
- 不適切なコンテンツを報告
1. There will be hardware version information on the debugger, or you can use J-Link Configurator to get the current version information
2.Sorry, the "disconnect" option cannot be used (I reproduced the problem), so you can use the "Terminate" option


