- NXP Forums
- Product Forums
- General Purpose MicrocontrollersGeneral Purpose Microcontrollers
- i.MX Forumsi.MX Forums
- QorIQ Processing PlatformsQorIQ Processing Platforms
- Identification and SecurityIdentification and Security
- Power ManagementPower Management
- MCX Microcontrollers
- S32G
- S32K
- S32V
- MPC5xxx
- Other NXP Products
- Wireless Connectivity
- S12 / MagniV Microcontrollers
- Powertrain and Electrification Analog Drivers
- Sensors
- Vybrid Processors
- Digital Signal Controllers
- 8-bit Microcontrollers
- ColdFire/68K Microcontrollers and Processors
- PowerQUICC Processors
- OSBDM and TBDML
-
- Solution Forums
- Software Forums
- MCUXpresso Software and ToolsMCUXpresso Software and Tools
- CodeWarriorCodeWarrior
- MQX Software SolutionsMQX Software Solutions
- Model-Based Design Toolbox (MBDT)Model-Based Design Toolbox (MBDT)
- FreeMASTER
- eIQ Machine Learning Software
- Embedded Software and Tools Clinic
- S32 SDK
- S32 Design Studio
- Vigiles
- GUI Guider
- Zephyr Project
- Voice Technology
- Application Software Packs
- Secure Provisioning SDK (SPSDK)
- Processor Expert Software
-
- Topics
- Mobile Robotics - Drones and RoversMobile Robotics - Drones and Rovers
- NXP Training ContentNXP Training Content
- University ProgramsUniversity Programs
- Rapid IoT
- NXP Designs
- SafeAssure-Community
- OSS Security & Maintenance
- Using Our Community
-
- Cloud Lab Forums
-
- Home
- :
- MCUXpresso Software and Tools
- :
- MCUXpresso IDE
- :
- Re: Restart Button enable
Restart Button enable
- Subscribe to RSS Feed
- Mark Topic as New
- Mark Topic as Read
- Float this Topic for Current User
- Bookmark
- Subscribe
- Mute
- Printer Friendly Page
- Mark as New
- Bookmark
- Subscribe
- Mute
- Subscribe to RSS Feed
- Permalink
- Report Inappropriate Content
In the debug perspective I can't use the restart button, due to fact it's not enabled.
But in the customized perspective it's still enabled. There is something different to set ?
Solved! Go to Solution.
- Mark as New
- Bookmark
- Subscribe
- Mute
- Subscribe to RSS Feed
- Permalink
- Report Inappropriate Content
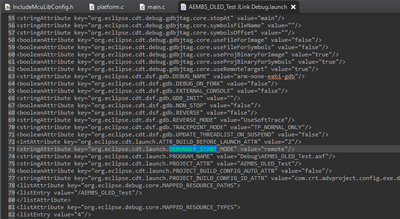
I had the same problem on a couple new projects. I think the problem happens when the debug configuration is created. I tried a few things and found if I remove this line from the .launch file the restart button becomes active:
<stringAttribute key="org.eclipse.cdt.launch.DEBUGGER_START_MODE" value="remote"/>
Give that a try, maybe it will help you as well.
- Mark as New
- Bookmark
- Subscribe
- Mute
- Subscribe to RSS Feed
- Permalink
- Report Inappropriate Content
So far, we've been unable to reproduce the problem. However, a small refactoring that included the Restart toolbar/button has been done for the upcoming v11.1.0 release.
Greetings,
MCUXpresso IDE Support
- Mark as New
- Bookmark
- Subscribe
- Mute
- Subscribe to RSS Feed
- Permalink
- Report Inappropriate Content
I'm sorry I don't want to be heavvy but the restart button doesn't work yet.
Now we are 3 people using mcuxpresso but this kind of push button doesn't work.
3 different collegue, 3 different pc, same problem !!!
We can't use the restart button, it is still light gray !
How it's possible. May be something wrong wit os ? Perhaps there is a special set to be done with configuration ?
It's not so confortable to reload every time the prject.
Thanks...Claudio
- Mark as New
- Bookmark
- Subscribe
- Mute
- Subscribe to RSS Feed
- Permalink
- Report Inappropriate Content
- Mark as New
- Bookmark
- Subscribe
- Mute
- Subscribe to RSS Feed
- Permalink
- Report Inappropriate Content
Hi guys, thanks for your help.
Yes Erich I tried with terminate & launch. But the button is still disabled.
I'd like to test the Toe's proposal but where is that file ? Is it in the project path ?
Thanks.
Claudio
- Mark as New
- Bookmark
- Subscribe
- Mute
- Subscribe to RSS Feed
- Permalink
- Report Inappropriate Content
It is present in the .launch configuration file you are using. Open the .launch inside your project with a text editor or inside Eclipse
- Mark as New
- Bookmark
- Subscribe
- Mute
- Subscribe to RSS Feed
- Permalink
- Report Inappropriate Content
By default it is in the workspace directory:
workspace\.metadata\.plugins\org.eclipse.debug.core\.launches
But you can also make it a file that is local to the project by going to the debug configuration, Common tab, and select "Shared File"
- Mark as New
- Bookmark
- Subscribe
- Mute
- Subscribe to RSS Feed
- Permalink
- Report Inappropriate Content
Just in case, if the .launch is somehow screwed up: delete it (better: make a backup to see the difference later) and it will be recreated from scratch. Maybe that cures the problem?
- Mark as New
- Bookmark
- Subscribe
- Mute
- Subscribe to RSS Feed
- Permalink
- Report Inappropriate Content
I had the same problem on a couple new projects. I think the problem happens when the debug configuration is created. I tried a few things and found if I remove this line from the .launch file the restart button becomes active:
<stringAttribute key="org.eclipse.cdt.launch.DEBUGGER_START_MODE" value="remote"/>
Give that a try, maybe it will help you as well.
- Mark as New
- Bookmark
- Subscribe
- Mute
- Subscribe to RSS Feed
- Permalink
- Report Inappropriate Content
Good morning everyone,
I have successfully followed the instructions to enable the reset button with the MCUXpresso 11.3 version. Now I have updated my system with version 11.4 and the solution to delete the line in the .launch file no longer works, because every time I launch the debugger the .launch file is re-created with the line in question present. How can I fix the problem again?
- Mark as New
- Bookmark
- Subscribe
- Mute
- Subscribe to RSS Feed
- Permalink
- Report Inappropriate Content
@claudiobrunelli @paolocolombo @Toe
First of all, manual changes inside the IDE-managed launch configuration are completely discouraged... Users indirectly change its contents by interacting with the Debug Configurations section. Manual changes can have nasty side-effects as well.
@Toe - would you please explain how did you conclude that "DEBUGGER_START_MODE" is the attribute that must be removed?
We would also need the following details from anyone experiencing the described issue:
- What IDE version?
- What MCU/board?
- What type of project (e.g. SDK-based)?
- Is the problem reproducible with a 'hello world' project from SDK
- What SDK version?
- What debug solution (e.g. LinkServer, PEmicro, J-Link)?
- Is a debug session on some other probe type exhibiting the same problem?
- If PEmicro/J-Link is used, are these software packages changed/updated compared to what the IDE is shipped with?
- How is the launch configuration created?
- If using the 'blue debug' button (see ch. 11.1.1 from User Guide), is the problem still reproducible?
- Attach here the problematic launch configurations.
I also noticed in the previous posts that "workspace\.metadata\.plugins\org.eclipse.debug.core\.launches" was referred as the placeholder for created launch configurations. If this is the case, then this is a potential sign that launch configurations are manually created instead of using the 'blue debug' button (see ch. 11.1.1 from User Guide). The launch configurations should be inside the project. Manually created launch configuration might have incorrectly attributes set (e.g. "DEBUGGER_START_MODE").
Please help with the above information. Maybe if we have the requested data, we can try a blind fix at some point...
Greetings,
MCUXpresso IDE Support
- Mark as New
- Bookmark
- Subscribe
- Mute
- Subscribe to RSS Feed
- Permalink
- Report Inappropriate Content
I found the problem by doing a diff between different .launch files. I had a few that did have the restart button active and some that didn't. I tried a few options before narrowing in that the DEBUGGER_START_MODE tag was the culprit in the non-working launch and removing it
1.) I'm currently using 11.4 and 11.3.1, but have seen it in versions prior to these.
2.) K22, KL17, K40, K60, and K12 MCUs using custom boards.
3.) SDK based project.
4.) Yes. To provide additional details I just created a K64 project using SDK 2.8.2 for the FRDM K64 board. I did not add any additional drivers or code. The SDA connection on my FRDM board is setup to use the PEMicro OpenSDA firmware. I have attached the .launch file generated, debugging with this file does have the "restart" button greyed out. By taking the same file and removing the line in question, that button comes back after restarting the IDE.
5.) SDK version does not matter for the MCUs listed, but see #4.
6.) PEMicro
7.) I have seen this with OpenSDA and the PEMicro multilinks. I do not recall seeing it with Segger OpenSDA or J-Link, but those are not the most used solutions for us.
8.) No, the drivers from the IDE are what is being used.
9.) I usually create my launch configurations by going to the debug configurations screen and double clicking on the interface I intend to use. This generates a basic configuration that I can edit. By default these are set to be saved as a "local" file which lives in the workspace dir for the IDE; this can be changed to a "shared" file and is easier to find. This method of generation obviously does things different than the blue button method.
10.) No, the file generated that way does not have the broken line.
11.) The file is attached.
It seems that the debug configuration manager needs to use the same method of generating the .launch file as the blue button from the quickstart panel. That configuration manager is the way files are accessed or modified after they are created anyway.
- Mark as New
- Bookmark
- Subscribe
- Mute
- Subscribe to RSS Feed
- Permalink
- Report Inappropriate Content
Thanks a lot. This is valuable information. So long story short, only manually created PEmicro debug configurations cause the described behavior. Now that we narrowed down the problem, we'll try to reproduce it on our side.
It seems that the debug configuration manager needs to use the same method of generating the .launch file as the blue button from the quickstart panel. That configuration manager is the way files are accessed or modified after they are created anyway.
Creating launch configurations the way you described (i.e. double-clicking the debug solution type) is not something that is completely under our control, thus some differences with regards to the attributes added in the launch configuration. The UG chapter I mentioned in my previous post even has an important note that's related to what I've just written (see screenshot below).
Given current data, I recommend using the blue debug button for starting a debug session, as described in the User Guide. Once the debug configuration is created this way, it can be further changed as needed.
Greetings,
MCUXpresso IDE Support
- Mark as New
- Bookmark
- Subscribe
- Mute
- Subscribe to RSS Feed
- Permalink
- Report Inappropriate Content
I had a lot of problems with transitioning from 11.3.1 to 11.4.0 - one of the biggies is that the workspace is not compatible between the versions.
If you're using the same workspace, then I recommend that you create a new one and recreate your projects in there. It was suggested that you can drag and drop the projects between workspaces but I think it's safer to bring in the source and create a new project in the workspace.
Good luck!
- Mark as New
- Bookmark
- Subscribe
- Mute
- Subscribe to RSS Feed
- Permalink
- Report Inappropriate Content
Hi Toe, Hi Erich.
My apologies for late reply.
I didn't try till today yours suggestions. Now, finally, the restart button works properly. It's not enought to delete the .launch files and recreate it. The the string attribute key DEBUGGER_START_MODE, must be removed too from file otherwise the button is always locked.
Thanks a lot.
Claudio
- Mark as New
- Bookmark
- Subscribe
- Mute
- Subscribe to RSS Feed
- Permalink
- Report Inappropriate Content
That's an interesting route.
But I do have this
<stringAttribute key="org.eclipse.cdt.launch.DEBUGGER_START_MODE" value="remote"/>
present in my launch files and the restart button is enable too.
Curious how removing it would trigger something different?
But worth a try for sure, let us know.
- Mark as New
- Bookmark
- Subscribe
- Mute
- Subscribe to RSS Feed
- Permalink
- Report Inappropriate Content
Hi @claudiobrunelli ,
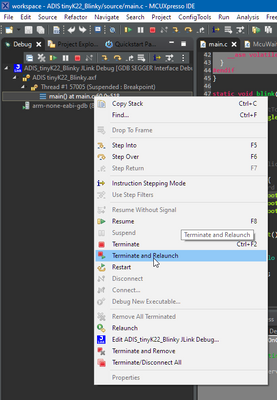
could you share a screenshot and the version/host you are on by now?
I'm on Win10 64 J-Link and on 11.2.1 and I can tell it works for me:
Few ideas what could cause this:
- did you try with a fresh/new workspace too?
- reset the perspective(s)?
- did you had the 'Quickstart' view open/active: this one seems to have an impact on the debug icons, so make sure it is shown at least once.
I hope this helps,
Erich
- Mark as New
- Bookmark
- Subscribe
- Mute
- Subscribe to RSS Feed
- Permalink
- Report Inappropriate Content
Hi Erich
I'm using a window 10 PRO, just a freedom board based on KE16 (but I did the same problem on K27 and a factory target too) and the system debug was at the beginning the open SDA than now a Universal multilink of PEMicro.
But it's still doesn't work this button. My collegues too, have the same problem. If you need other info I can give it of course.
Thanks in advance, Claudio
- Mark as New
- Bookmark
- Subscribe
- Mute
- Subscribe to RSS Feed
- Permalink
- Report Inappropriate Content
Hi @claudiobrunelli ,
which IDE/version?
I'm on V11.2.1 (https://mcuoneclipse.com/2020/10/17/mcuxpresso-ide-v11-2-1/ ) and I can say that it works there for me (Win10 64bit, mostly using Kinetis and LPC parts):
I had issues in the past too, and this is what helped me:
- try with a fresh/new workspace: When I did too much toolbar customization I faced some issues
- make sure that the Quickstart view is loaded/visible. E.g. switch to the 'Develop' perspective to see if this helps
Any other details you could share would be helpful to find out what is missing or different on your end.
I hope this helps,
Erich
- Mark as New
- Bookmark
- Subscribe
- Mute
- Subscribe to RSS Feed
- Permalink
- Report Inappropriate Content
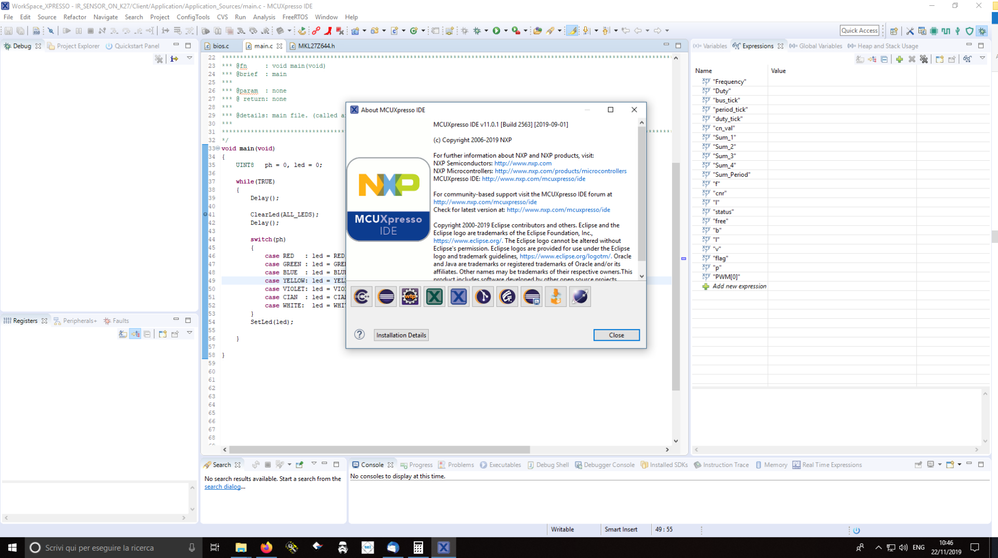
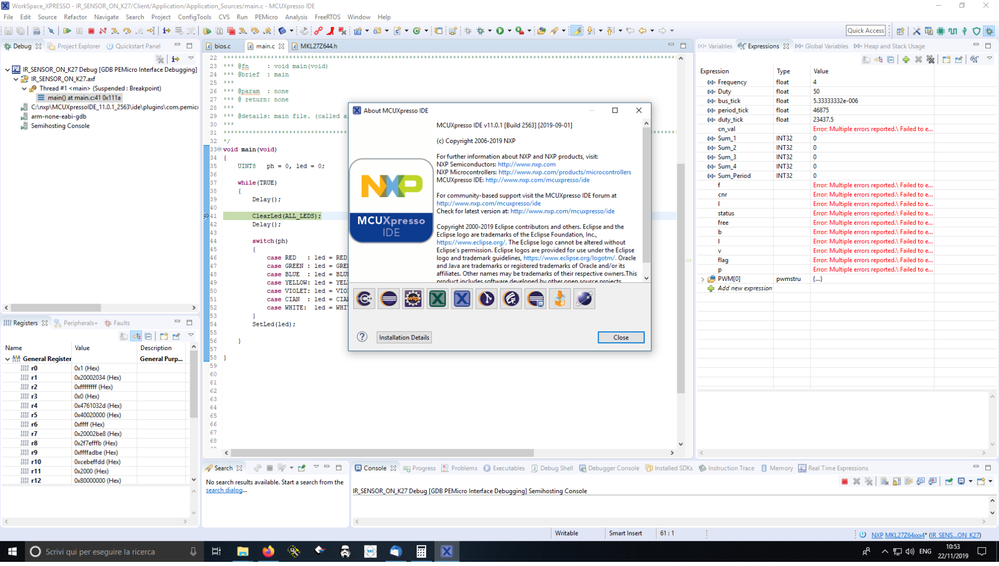
I take note about your answer. Just to clarify than, I send you other screenshot where there's my xpresso release.
If you have news about this strange problem, please advice me. Thanks a lot.
Claudio
- Mark as New
- Bookmark
- Subscribe
- Mute
- Subscribe to RSS Feed
- Permalink
- Report Inappropriate Content
It should be enabled. Please note that its enablement depends on the currently selected context from Debug view. In other words, you'll have to select the thread or the main process, not the top-level item associated with the debug configuration.
Greetings,
MCUXpresso IDE Support
- Mark as New
- Bookmark
- Subscribe
- Mute
- Subscribe to RSS Feed
- Permalink
- Report Inappropriate Content
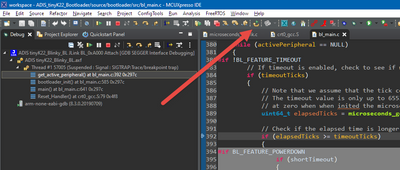
The screenshot actually shows that a context (and not the top level item) is selected, and the restart button is disabled. So imho this is caused by this.
I thought it might be related to the P&E debug probe, but I have it working on my side (just checked again) (see my screenshot). So all good there (using K22)
I don't have a KE device so not sure if this is related to the device or not.
I hope this helps,
Erich

