- Forums
- Product Forums
- General Purpose MicrocontrollersGeneral Purpose Microcontrollers
- i.MX Forumsi.MX Forums
- QorIQ Processing PlatformsQorIQ Processing Platforms
- Identification and SecurityIdentification and Security
- Power ManagementPower Management
- Wireless ConnectivityWireless Connectivity
- RFID / NFCRFID / NFC
- Advanced AnalogAdvanced Analog
- MCX Microcontrollers
- S32G
- S32K
- S32V
- MPC5xxx
- Other NXP Products
- S12 / MagniV Microcontrollers
- Powertrain and Electrification Analog Drivers
- Sensors
- Vybrid Processors
- Digital Signal Controllers
- 8-bit Microcontrollers
- ColdFire/68K Microcontrollers and Processors
- PowerQUICC Processors
- OSBDM and TBDML
- S32M
- S32Z/E
-
- Solution Forums
- Software Forums
- MCUXpresso Software and ToolsMCUXpresso Software and Tools
- CodeWarriorCodeWarrior
- MQX Software SolutionsMQX Software Solutions
- Model-Based Design Toolbox (MBDT)Model-Based Design Toolbox (MBDT)
- FreeMASTER
- eIQ Machine Learning Software
- Embedded Software and Tools Clinic
- S32 SDK
- S32 Design Studio
- GUI Guider
- Zephyr Project
- Voice Technology
- Application Software Packs
- Secure Provisioning SDK (SPSDK)
- Processor Expert Software
- Generative AI & LLMs
-
- Topics
- Mobile Robotics - Drones and RoversMobile Robotics - Drones and Rovers
- NXP Training ContentNXP Training Content
- University ProgramsUniversity Programs
- Rapid IoT
- NXP Designs
- SafeAssure-Community
- OSS Security & Maintenance
- Using Our Community
-
- Cloud Lab Forums
-
- Knowledge Bases
- ARM Microcontrollers
- i.MX Processors
- Identification and Security
- Model-Based Design Toolbox (MBDT)
- QorIQ Processing Platforms
- S32 Automotive Processing Platform
- Wireless Connectivity
- CodeWarrior
- MCUXpresso Suite of Software and Tools
- MQX Software Solutions
- RFID / NFC
- Advanced Analog
-
- NXP Tech Blogs
- Home
- :
- Product Forums
- :
- 8-bit Microcontrollers
- :
- S08 Debug (Pause) No source available for "0xFFFF (0xFFFF)()"
S08 Debug (Pause) No source available for "0xFFFF (0xFFFF)()"
- Subscribe to RSS Feed
- Mark Topic as New
- Mark Topic as Read
- Float this Topic for Current User
- Bookmark
- Subscribe
- Mute
- Printer Friendly Page
S08 Debug (Pause) No source available for "0xFFFF (0xFFFF)()"
- Mark as New
- Bookmark
- Subscribe
- Mute
- Subscribe to RSS Feed
- Permalink
- Report Inappropriate Content
I have a bare project that I've started for the MC9S08PA with the following main.c
#include <hidef.h> /* for EnableInterrupts macro */
#include "derivative.h" /* include peripheral declarations */
void main(void) {
EnableInterrupts;
/* include your code here */
for(;;) {
__RESET_WATCHDOG(); /* feeds the dog */
} /* loop forever */
/* please make sure that you never leave main */
}
I start a debug session and I hit <Pause> and then I see
No source available for "0xFFFF (0xFFFF)() "
I hit <F5>
No source available for "0x7B32 (0x7B32)() "
Then it goes to _RESET_WATCHDOG() and continues normally.
Sometimes it will start here and continue.
0x8032
0x0032
0x0035
0x0038
0x003b
0x003e
0x0040
0x0042
0x0043
and so forth
What is going on when this happens?
Thank you all!
- Mark as New
- Bookmark
- Subscribe
- Mute
- Subscribe to RSS Feed
- Permalink
- Report Inappropriate Content
can you please upload your project, thus we can check the problem direclty here?
- Mark as New
- Bookmark
- Subscribe
- Mute
- Subscribe to RSS Feed
- Permalink
- Report Inappropriate Content
- Mark as New
- Bookmark
- Subscribe
- Mute
- Subscribe to RSS Feed
- Permalink
- Report Inappropriate Content
Hi
this seems to me as empty project to me, I would check the connections of your BDM
ROM = READ_ONLY 0xF000 TO 0xFF6F;
this is definition of your FLASH space
address 0x7b32 is not defined.
I took your project and as I do not have any PA4, I have changed the connection to simulator, there was a msg that profiler is not available for simulator
Have you done anything with profieler here?
Pavel
- Mark as New
- Bookmark
- Subscribe
- Mute
- Subscribe to RSS Feed
- Permalink
- Report Inappropriate Content
Hello Pavel,
"this seems to me as empty project to me" That was the point. If I put in any code I would be told that it was "this or that" and I would like to get to the root cause. This appears to have nothing to do with code.
I know that 0x7b32 is not in the FLASH, neither is 0xFFFF. As far as the profiler, I have not done anything with it.
I have tried a shorter cable. The usb cable I was using was 3m and I replaced it with a 1m and it seems marginally better but I still end up where I was.
- Mark as New
- Bookmark
- Subscribe
- Mute
- Subscribe to RSS Feed
- Permalink
- Report Inappropriate Content
Hi
standard BDM cables are just some 30cm long,
I have seen some discussions here in the past stating the length of BDM can cause huge troubles.
1m is still too long
Pavel
- Mark as New
- Bookmark
- Subscribe
- Mute
- Subscribe to RSS Feed
- Permalink
- Report Inappropriate Content
Hello Pavel,
I am saying USB and you are saying BDM. I don't think we are talking about the same thing.
My BDM cable is the standard cable that comes with the PEmicro Multilink Interface and I believe that to be about 30cm long. (BDM being the cable that is actually transferring the debugging information from the BDM. A 6 conductor gray flat ribbon cable with a red color indicating the #1 pin)
The USB cable was 3m and I tried a 1m and now I am down to about 10" or 25.5cm of USB cable link. None of this has helped.
Thank you for your help.
- Mark as New
- Bookmark
- Subscribe
- Mute
- Subscribe to RSS Feed
- Permalink
- Report Inappropriate Content
Hi,
oh, sorry for my misreading...
Let's return back to your empty project
I do not have any PA4 device here for tests, however the code you provided points to strange entry point and does not have any vectors cured, usually we use traps to catch any idle interrupts even when they are not used actively in the code, especilally as you have interrupts enabled from the template.
I have made different empty project - using default setting of Processor Expert
this way, vectors are filled with dummy ISR causing a reset and entry point is now correct at 0xF004
try to run this code and give me feedback if you still see the misbehavior or not, please
Pavel
- Mark as New
- Bookmark
- Subscribe
- Mute
- Subscribe to RSS Feed
- Permalink
- Report Inappropriate Content
Hello Pavel,
Firstly, I open Codewarrior and select "Import" from the File menu.
I select, under General, "Existing Projects into Workspace" and click "Next".
Then I browsed to the directory where the code "Gregory_PA4_PE is located and click "Finish".
I compile and I get the following result
| Description | Resource | Path | Location | Type |
| mingw32-make: *** No rule to make target `C:/Users/B34196/workspace_10.4_KE02/Gregory_PA4_PE/Project_Headers/../Sources/Events.c', needed by `Sources/Events_c.obj'. | Gregory_PA4_PE | C/C++ Problem |
Nice.
I understand that the ISR could be an issue. I was trying to show that the project created by codewarrior has the issue without any intervention from me.
Now to exclude spurious interrupts I have changed the code to this.
#include <mc9s08pa4.h>
void main(void) {
PORT_PTBOE = 0x07;
for(;;) {
PORT_PTBD_PTBD1=1;
PORT_PTBD_PTBD1=0;
}
}
I run the code as before. In Debug. Then I try to "Pause" and I get
No source available for "0x0000 (0x0000)() "
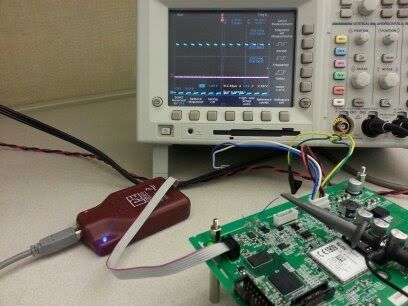
The code continues to run as the scope shows that the output is being turned toggled at about 616.5K but I have lost connection with the chip.
This is "VERY" repeatable.
From what I'm seeing I don't think this is anything I'm doing in software. Is there something wrong with my multilink? Is there something wrong with the chip I'm using?
Thank you for your help!
- Mark as New
- Bookmark
- Subscribe
- Mute
- Subscribe to RSS Feed
- Permalink
- Report Inappropriate Content
Hello again,
Finally had a chance to try this with the TWR-S08PT60 that I just got last week. With the same desktop computer, multilink, and cables I am seeing exactly the same thing. I've tried it on my laptop, which has a different configuration. I loaded the software from the TWR-S08PT60 software and drivers from the disk. The laptop faults out too, in a similar fashion.
Am I expecting too much from this software/hardware?
Is the pause button something that can be used only in certain situations?
I've seen other weirdness in debugging. Is this all related?
Is this a bad PEmicro multilink debugger?
Thanks again for all your help.
- Mark as New
- Bookmark
- Subscribe
- Mute
- Subscribe to RSS Feed
- Permalink
- Report Inappropriate Content
Hi,
oh, this might be complicated to figure out where the issue is.
You can test the OSBDM populated on TWR board instead of your multilink - this way you exclude also the programmer.
I would reinstall the CW with freshly downloaded one, including update.
if this does not help, please place the service request to Freescale pages
http://www.freescale.com/webapp/sps/site/homepage.jsp?code=SUPPORTHOME&tid=FSH
I was not able to reproduce your issue here, so my assumption is that you should succeed with some of steps above.
at least I hope so :smileywink:
Pavel
- Mark as New
- Bookmark
- Subscribe
- Mute
- Subscribe to RSS Feed
- Permalink
- Report Inappropriate Content
Hello Pavel,
I have an update and a little more information.
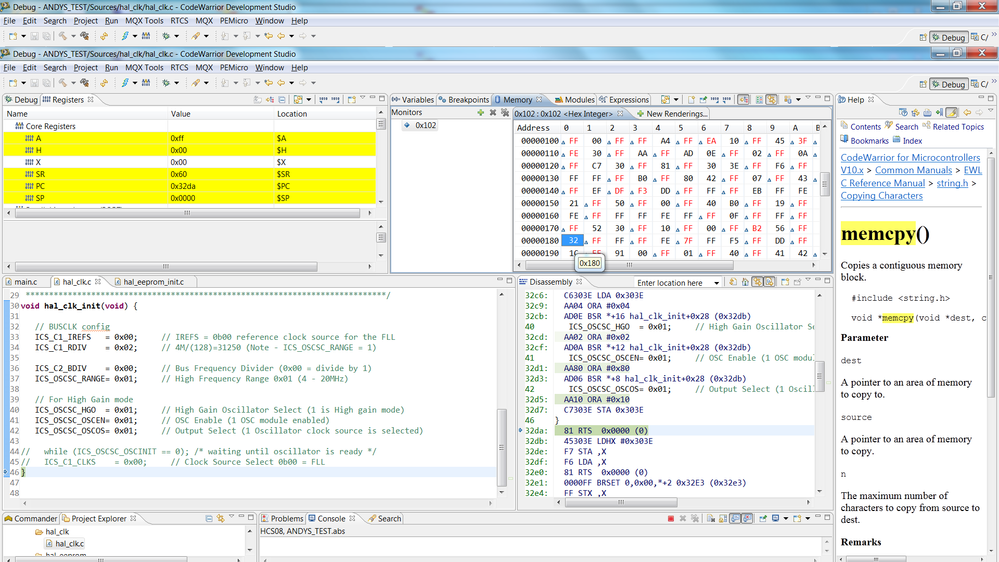
I got a TWR-9s08pt60 and have successfully got it debugging through the OSBDM. While debugging code that just initializes the clock, I was able to capture what is going on. Please take a look at the image I have attached.
Thanks for all the help!
- Mark as New
- Bookmark
- Subscribe
- Mute
- Subscribe to RSS Feed
- Permalink
- Report Inappropriate Content
我遇到和你同样的问题,就是经常出现
No source available for "0xFFFF (0xFFFF)()"
一直没解决,以前我用的是MC9S08SC4,编译器是CW6.3,就没遇到过这个问题
后来用了MC9S08PA4,就会出现这个问题,飞思卡尔的FAE来我这看过,不过没解决
- Mark as New
- Bookmark
- Subscribe
- Mute
- Subscribe to RSS Feed
- Permalink
- Report Inappropriate Content
I would recommend in this issue to start at the basics.
First, check if the reset vector at 0xFFFE/0xFFFE are reasonably programmed. Say point into the startup handler (and are not just 0xFF,0xFF).
Then reset the device and assembly step. Should be at the startup handler, and you should be able to see where the core leaves the expected path.
Make sure the code executed corresponds to the code to be flashed.
Note that the default setup for the debugger launch is to set a breakpoint at main and to resume the target. That's a nice behavior if the core reaches main....
But if something badly went wrong, say the app is not properly flashed, then I'm not surprised you see some strange code being executed when randomly stopping.
Daniel
- Mark as New
- Bookmark
- Subscribe
- Mute
- Subscribe to RSS Feed
- Permalink
- Report Inappropriate Content
Hello Guru,
I verified that the startup code was being executed. I also verified that 0xFFFF/0xFFFE is pointing to the beginning of startup. Please take a look at the image I posted and let me know what you think.
Thank you very much for your help!

