- Forums
- Product Forums
- General Purpose MicrocontrollersGeneral Purpose Microcontrollers
- i.MX Forumsi.MX Forums
- QorIQ Processing PlatformsQorIQ Processing Platforms
- Identification and SecurityIdentification and Security
- Power ManagementPower Management
- Wireless ConnectivityWireless Connectivity
- RFID / NFCRFID / NFC
- Advanced AnalogAdvanced Analog
- MCX Microcontrollers
- S32G
- S32K
- S32V
- MPC5xxx
- Other NXP Products
- S12 / MagniV Microcontrollers
- Powertrain and Electrification Analog Drivers
- Sensors
- Vybrid Processors
- Digital Signal Controllers
- 8-bit Microcontrollers
- ColdFire/68K Microcontrollers and Processors
- PowerQUICC Processors
- OSBDM and TBDML
- S32M
- S32Z/E
-
- Solution Forums
- Software Forums
- MCUXpresso Software and ToolsMCUXpresso Software and Tools
- CodeWarriorCodeWarrior
- MQX Software SolutionsMQX Software Solutions
- Model-Based Design Toolbox (MBDT)Model-Based Design Toolbox (MBDT)
- FreeMASTER
- eIQ Machine Learning Software
- Embedded Software and Tools Clinic
- S32 SDK
- S32 Design Studio
- GUI Guider
- Zephyr Project
- Voice Technology
- Application Software Packs
- Secure Provisioning SDK (SPSDK)
- Processor Expert Software
- Generative AI & LLMs
-
- Topics
- Mobile Robotics - Drones and RoversMobile Robotics - Drones and Rovers
- NXP Training ContentNXP Training Content
- University ProgramsUniversity Programs
- Rapid IoT
- NXP Designs
- SafeAssure-Community
- OSS Security & Maintenance
- Using Our Community
-
- Cloud Lab Forums
-
- Knowledge Bases
- ARM Microcontrollers
- i.MX Processors
- Identification and Security
- Model-Based Design Toolbox (MBDT)
- QorIQ Processing Platforms
- S32 Automotive Processing Platform
- Wireless Connectivity
- CodeWarrior
- MCUXpresso Suite of Software and Tools
- MQX Software Solutions
- RFID / NFC
- Advanced Analog
-
- NXP Tech Blogs
- Home
- :
- Software Forums
- :
- S32 Design Studio
- :
- Compiler MPC5777C
Compiler MPC5777C
- Subscribe to RSS Feed
- Mark Topic as New
- Mark Topic as Read
- Float this Topic for Current User
- Bookmark
- Subscribe
- Mute
- Printer Friendly Page
- Mark as New
- Bookmark
- Subscribe
- Mute
- Subscribe to RSS Feed
- Permalink
- Report Inappropriate Content
Hello,
i want to use a Trace32 Debugger to program and debug the MPC5777C Evaluation Board.
I have read and customized some examples with the S32DS IDE, now i want to compile and then run my own software on the actual Hardware.
But I still have some basic questions: how do i get the project files executable for the Lauterbach Debugger to program the MPC5777C?
Is the S32DS IDE sufficient to generate a .cmm File from a build/released project file?
Or is a Crosscompiler from Greenhills or Windriver mandatory, so is S32DS just for programming and then forward the compiler released/build project files?
I would appreciate some clarification, thanks in advance!
Florens
Solved! Go to Solution.
- Mark as New
- Bookmark
- Subscribe
- Mute
- Subscribe to RSS Feed
- Permalink
- Report Inappropriate Content
Hi Florens,
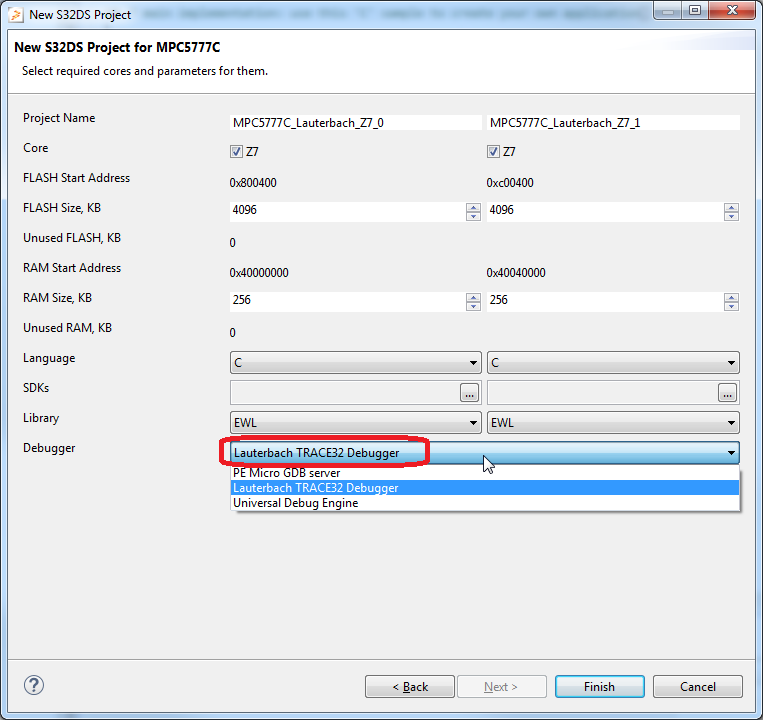
S32 Design Studio Project Wizard can create GCC project + TRACE32 debug configuration automatically:
The Project Wizard allows you to create a project with any mix of the build tools (GHS, Windriver, GCC) and debug interface (GDB, Pemicro, PLS, Lauterbach).
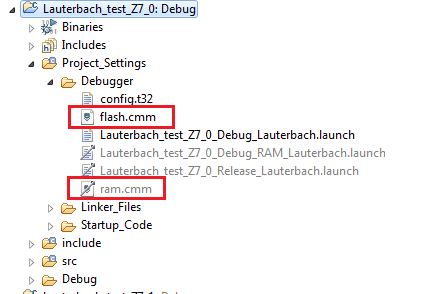
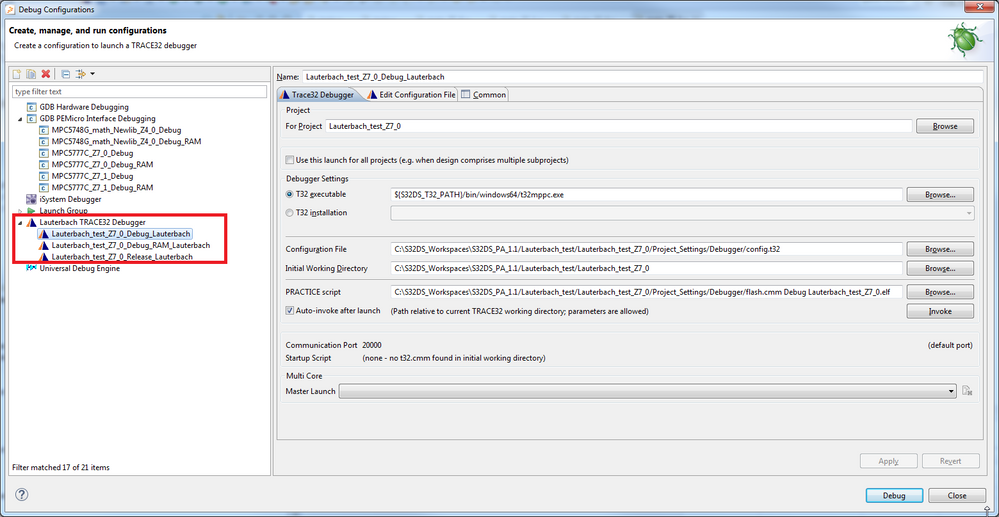
For Lauterbach debug option - .cmm scripts are included in the project folder (see the screenshot below) Lauterbach configuration is available in Debug Configuration dialog.
All you need to do is to install Lauterbach Eclipse plugin into S32 Design Studio (it's not part of S32DS installer).
The integration is documented in S32DS reference manual:
"<S32_Power_v1.1>\S32DS\help\pdf\s32ds.pwr.win.reference_manual.pdf" , section "6.2 Lauterbach connection".
Hope it helps!
Stan
- Mark as New
- Bookmark
- Subscribe
- Mute
- Subscribe to RSS Feed
- Permalink
- Report Inappropriate Content
Hi Stan,
I have tested the debug configuration on the actual Hardware and it works (partially).
As far as I understand: S32DS create a .ELF file with the GCC Compiler, the flash.cmm skript is for the Lauterbach Debugger to transfer the executable file on the MPC5777C.
there are 3 configs for each project:
1. "..._Z7_0_Debug_Lauterbach" - trace32 starts and i can debug the program and see the source files.
The generated .ELF File is also executable with customized .cmm skripts out of trace32. So this case cover my needs.
2. "..._Z7_0_Release_Lauterbach" - the created .ELF File works too, but trace32 will not load the source files correctly: while debugging in Trace32 i can only see the ASM (assembler) sourcecode, i cant switch too Hll (High Level Language) correctly. Same problem with customized .cmm skripts where i tried to reload them.
Any Ideas how to fix this problem or is there no difference between debug and released files? (So i would just continue to use the debug config)
3. "..._Z7_0_Debug_RAM_Lauterbach" - this one use the ram.cmm script but trace32 can't find the correct .ELF file (not generated or wrong file path), so it doesn't work.
Thanks again for your help,
Florens
- Mark as New
- Bookmark
- Subscribe
- Mute
- Subscribe to RSS Feed
- Permalink
- Report Inappropriate Content
Hello Florens,
each S32DS project for MPC57xx created by the project Wizard contains 3 different build configurations by default.
1) Debug - this is targeting internal flash memory, optimization are off for easy debugging
2) Debug RAM - basically same as Debug but program is linked into RAM memory instead of Flash/ROM. This makes debugging faster - internal flash is not programmed at all but it may require re-programming after a reset.
3) Release - this is basically a version with the compiler optimizations enabled and without debug information (e.g. production version). The linker place the code/consts into flash memory (same as Debug).
Each build configuration creates separate folder (Debug/Debug_RAM/Release) where the output (elf) file is generated into.
Before debugging please make sure the elf file exist - I suspect this could be causing the issue with Debug_RAM you ve observed.
The source code is not visible in case of Release version of elf file because the debug information is switched off intentionally by default. You can try to enable it in the compiler settings and debug the optimized version of your project. But debugging of highly optimized code could be quite challenging.
Hope it helps!
Stan
- Mark as New
- Bookmark
- Subscribe
- Mute
- Subscribe to RSS Feed
- Permalink
- Report Inappropriate Content
Hi Stan,
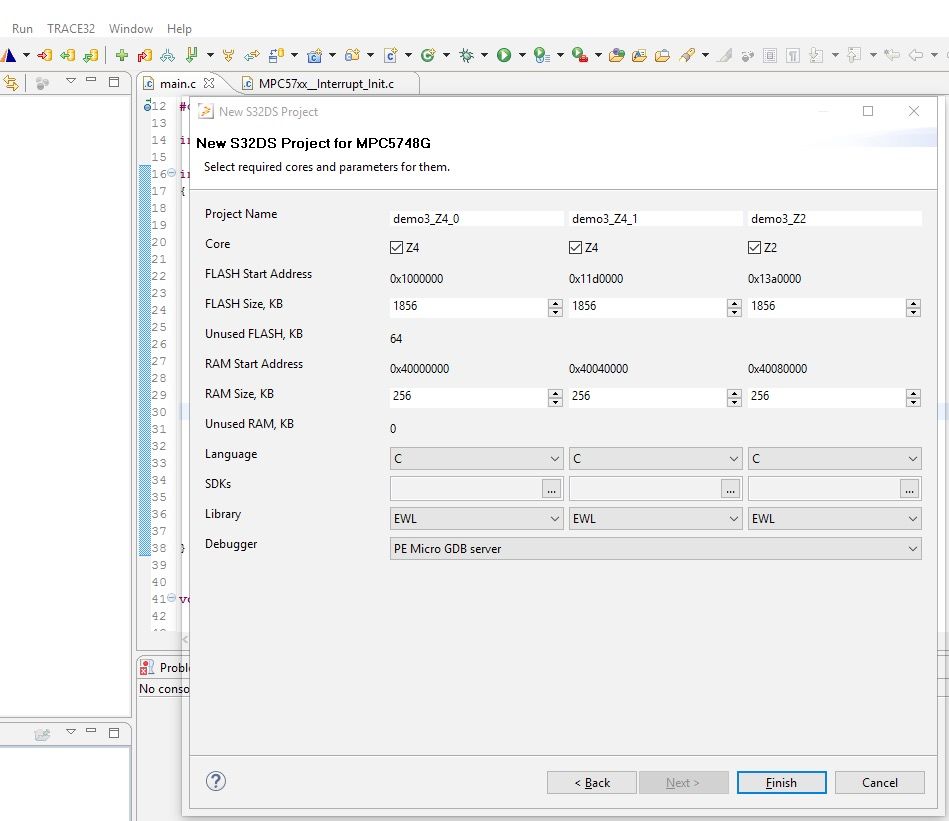
looks nice, but my S32DS installation shows no T32 option to select.
Actually I wasn't able to install the T32 eclipse plugin at first with error message "requires 'org.eclipse.tcf.core 0.0.0'", but then I cloned the eclipse git (git://git.eclipse.org/gitroot/tcf/org.eclipse.tcf.git) and basically dumped the plugins into the plugins folder, which made it work partially, because under Debug Config, there is no T32 as shown in your screenshot but I have a T32 navigation menu now at least.
Any ideas what it could be? Florens it works for you as I understood.
Many thanks,
Ludwig
Screenshot: T32 nor UDE can be selected from Debugger option.
- Mark as New
- Bookmark
- Subscribe
- Mute
- Subscribe to RSS Feed
- Permalink
- Report Inappropriate Content
Hello Ludwig,
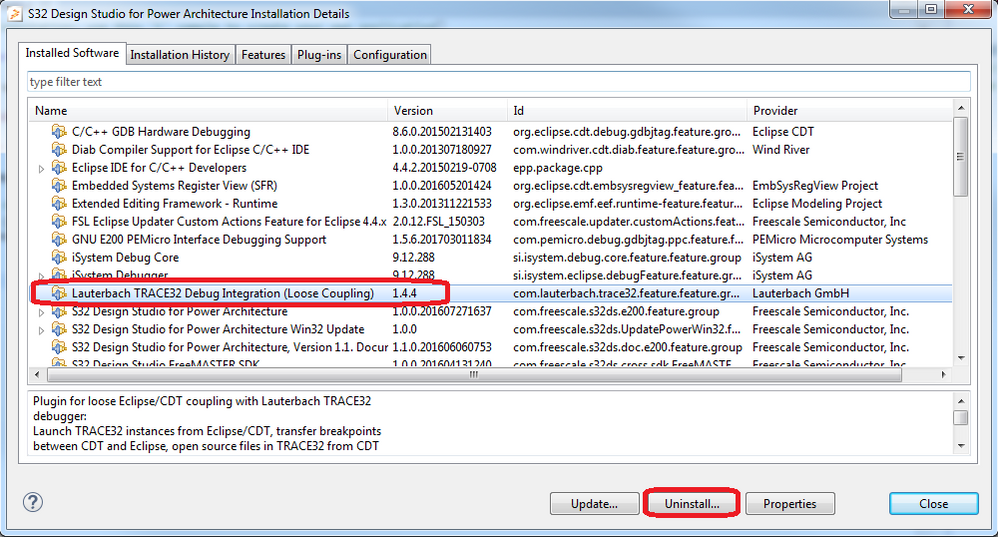
It seems you installed a different plug-in. Currently S32DS does not support TCF version plug-in by Lauterbach.
I'd suggest to uninstall the plug-in you installed (go to menu "Help" -> "Installation Details" and search the Lauterbach plug-in there). You will probably see a different name since the one on the picture below is the supported one:
Now restart S32DS and install the supported variant of Lauterbach eclipse plug-in:
HOWTO: Install Lauterbach TRACE32 debugger plug-in into S32 Design Studio
Hope it helps!
Stan
- Mark as New
- Bookmark
- Subscribe
- Mute
- Subscribe to RSS Feed
- Permalink
- Report Inappropriate Content
Hi Stan,
thanks for this hint! I was further wondering if you can hook the T32 simulator(s) instead of a real target, that would be interesting for small experiments.
Regards
- Mark as New
- Bookmark
- Subscribe
- Mute
- Subscribe to RSS Feed
- Permalink
- Report Inappropriate Content
Thanks Stanislav,
i installed the Lauterbach Eclipse plugin and can create new projects with the automatic debug configuration.
When i debug a project, trace32 will open and it says connection with eclipse established, it seems to work!
I will get the MPC5777C next week so i just tested some projects with the trace32 powerpc simulator.
Florens
- Mark as New
- Bookmark
- Subscribe
- Mute
- Subscribe to RSS Feed
- Permalink
- Report Inappropriate Content
Hi fraidling,
did you check for a suitable *.cmm inside the demo projects?
Another option is checking inside your T32 demo folder, there are several 5777 cmm files.
S32 is not generating cmm file, it's scripted usually by hand I think.
Regards,
Lu
