- Forums
- Product Forums
- General Purpose MicrocontrollersGeneral Purpose Microcontrollers
- i.MX Forumsi.MX Forums
- QorIQ Processing PlatformsQorIQ Processing Platforms
- Identification and SecurityIdentification and Security
- Power ManagementPower Management
- Wireless ConnectivityWireless Connectivity
- RFID / NFCRFID / NFC
- Advanced AnalogAdvanced Analog
- MCX Microcontrollers
- S32G
- S32K
- S32V
- MPC5xxx
- Other NXP Products
- S12 / MagniV Microcontrollers
- Powertrain and Electrification Analog Drivers
- Sensors
- Vybrid Processors
- Digital Signal Controllers
- 8-bit Microcontrollers
- ColdFire/68K Microcontrollers and Processors
- PowerQUICC Processors
- OSBDM and TBDML
- S32M
- S32Z/E
-
- Solution Forums
- Software Forums
- MCUXpresso Software and ToolsMCUXpresso Software and Tools
- CodeWarriorCodeWarrior
- MQX Software SolutionsMQX Software Solutions
- Model-Based Design Toolbox (MBDT)Model-Based Design Toolbox (MBDT)
- FreeMASTER
- eIQ Machine Learning Software
- Embedded Software and Tools Clinic
- S32 SDK
- S32 Design Studio
- GUI Guider
- Zephyr Project
- Voice Technology
- Application Software Packs
- Secure Provisioning SDK (SPSDK)
- Processor Expert Software
- Generative AI & LLMs
-
- Topics
- Mobile Robotics - Drones and RoversMobile Robotics - Drones and Rovers
- NXP Training ContentNXP Training Content
- University ProgramsUniversity Programs
- Rapid IoT
- NXP Designs
- SafeAssure-Community
- OSS Security & Maintenance
- Using Our Community
-
- Cloud Lab Forums
-
- Knowledge Bases
- ARM Microcontrollers
- i.MX Processors
- Identification and Security
- Model-Based Design Toolbox (MBDT)
- QorIQ Processing Platforms
- S32 Automotive Processing Platform
- Wireless Connectivity
- CodeWarrior
- MCUXpresso Suite of Software and Tools
- MQX Software Solutions
- RFID / NFC
- Advanced Analog
-
- NXP Tech Blogs
- Home
- :
- Software Forums
- :
- S32 Design Studio Knowledge Base
- :
- HOWTO: JTAG Flash Programming with S32 Debugger and S32 Debug Probe for S32R45 EVB
HOWTO: JTAG Flash Programming with S32 Debugger and S32 Debug Probe for S32R45 EVB
Turn on suggestions
Auto-suggest helps you quickly narrow down your search results by suggesting possible matches as you type.
Options
- Subscribe to RSS Feed
- Mark as New
- Mark as Read
- Bookmark
- Subscribe
- Printer Friendly Page
- Report Inappropriate Content
HOWTO: JTAG Flash Programming with S32 Debugger and S32 Debug Probe for S32R45 EVB
HOWTO: JTAG Flash Programming with S32 Debugger and S32 Debug Probe for S32R45 EVB
The S32 Debugger included within the S32 Design Studio for S32 Platform IDE provides the capability to access the flash programming capabilities of the S32 Debug Probe via the S32 Debugger.
Note: currently only QSPI flashing is supported.
Preparation
- Install S32 Design Studio IDE
- Install the Development Package for the device you are debugging. In this case, the S32R4xx development package. This package is important as the S32 Debugger support component contains the device-specific Python scripts required for initialization of the cores.
- Open the application project from which the flash image will be generated.
- Follow the steps in HOWTO: Generate S-Record/Intel HEX/Binary file , selecting the 'Raw Binary' option.
- Build the project, generating the binary executable. This will be our application binary input to the IVT Tool. The IVT Tool must be used to generate the BLOB image which can be programmed to flash memory device and loaded to the RAM by the BootROM.
Follow the steps in HOWTO: Use IVT Tool To Create A BLOB Image S32R45. The resulting BLOB image file is what can be flashed to the device.
Procedure
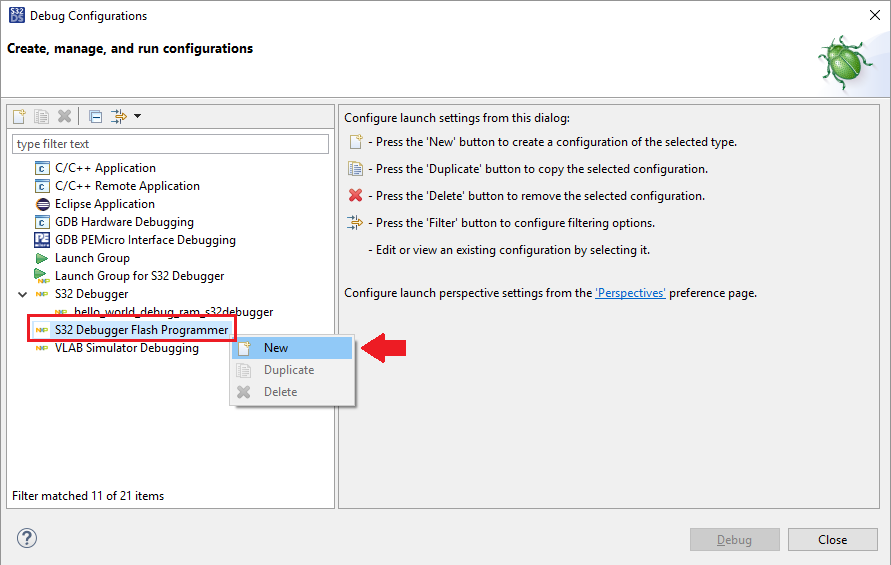
- Open Debug Configuration menu
- Select 'S32 Debugger Flash Programmer', then right-click and select New.
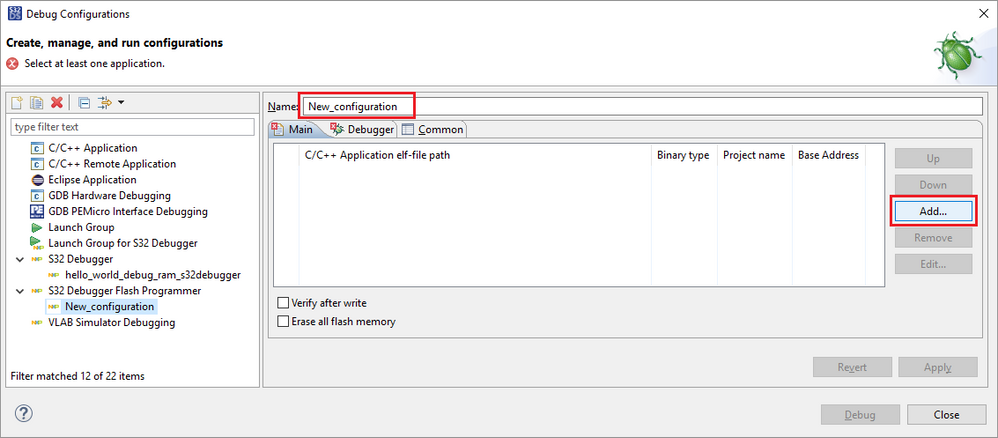
- Enter an name for the new configuration and click Add... to add the file to be flashed.
- Click Browse... to select the project from the workspace where the application binary is located
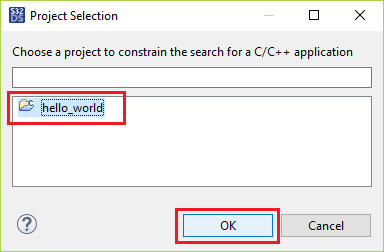
- Select the project and click OK
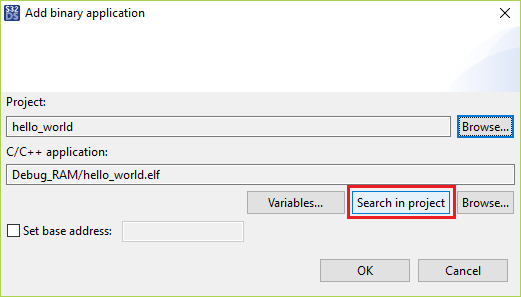
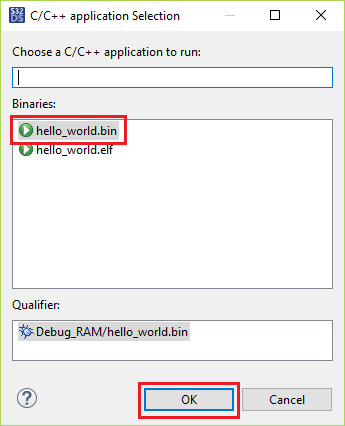
- By default, the ELF file is found. Click Search in project to select the binary file.
- Select the .bin file and click OK
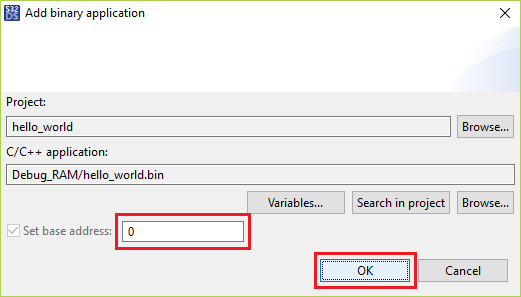
- Now we must enter the base address. Typically, this could be 0, but you may have other requirements. Click OK.
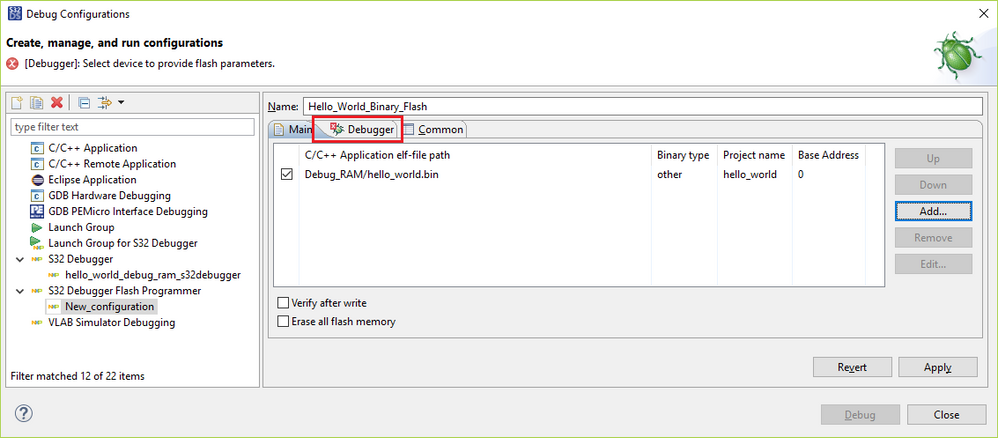
- Now we are ready to configure the debugger connection settings. Click on the Debugger tab.
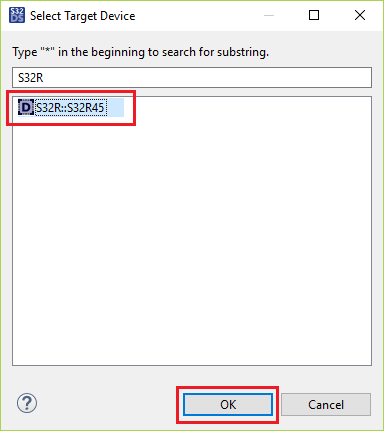
- Starting from the top and working our way down, click on Select device.
- Select the device and click OK
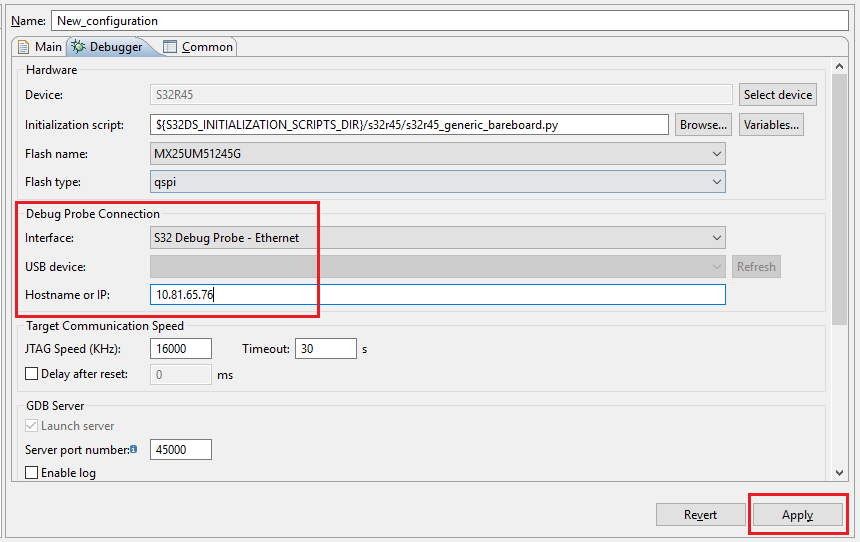
- The correct Initialization script will automatically be set. Set the Debug Probe Connection settings to match your setup. When done, click Apply
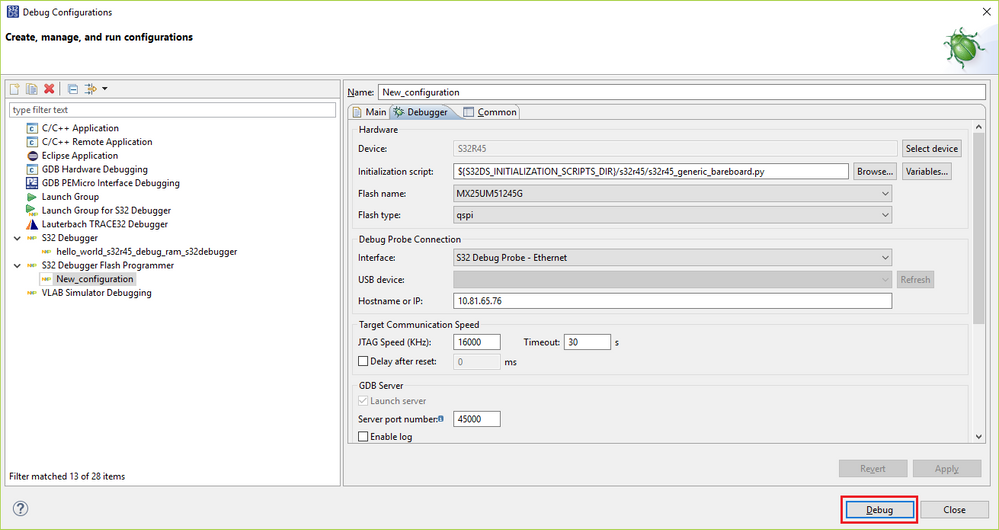
- To start the flashing, click Debug
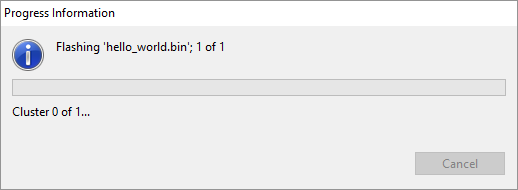
- Flashing progress will be displayed.
- When complete, the Debug perspective will show at terminated thread.
- Happy flashing with GDB!
Note, to debug this application since it will be subsequently started by the BootROM:
- use 's32r45_attach.py' in the Initialization script field on the debugger tab of the Debug Configurations menu
- Make the following adjustments on the Startup tab within the Debug Configurations menu:
- Uncheck "Load image"
- Check “Set program counter at:” and enter the value “Reset_Handler”
No ratings


