- Forums
- Product Forums
- General Purpose MicrocontrollersGeneral Purpose Microcontrollers
- i.MX Forumsi.MX Forums
- QorIQ Processing PlatformsQorIQ Processing Platforms
- Identification and SecurityIdentification and Security
- Power ManagementPower Management
- Wireless ConnectivityWireless Connectivity
- RFID / NFCRFID / NFC
- Advanced AnalogAdvanced Analog
- MCX Microcontrollers
- S32G
- S32K
- S32V
- MPC5xxx
- Other NXP Products
- S12 / MagniV Microcontrollers
- Powertrain and Electrification Analog Drivers
- Sensors
- Vybrid Processors
- Digital Signal Controllers
- 8-bit Microcontrollers
- ColdFire/68K Microcontrollers and Processors
- PowerQUICC Processors
- OSBDM and TBDML
- S32M
- S32Z/E
-
- Solution Forums
- Software Forums
- MCUXpresso Software and ToolsMCUXpresso Software and Tools
- CodeWarriorCodeWarrior
- MQX Software SolutionsMQX Software Solutions
- Model-Based Design Toolbox (MBDT)Model-Based Design Toolbox (MBDT)
- FreeMASTER
- eIQ Machine Learning Software
- Embedded Software and Tools Clinic
- S32 SDK
- S32 Design Studio
- GUI Guider
- Zephyr Project
- Voice Technology
- Application Software Packs
- Secure Provisioning SDK (SPSDK)
- Processor Expert Software
- Generative AI & LLMs
-
- Topics
- Mobile Robotics - Drones and RoversMobile Robotics - Drones and Rovers
- NXP Training ContentNXP Training Content
- University ProgramsUniversity Programs
- Rapid IoT
- NXP Designs
- SafeAssure-Community
- OSS Security & Maintenance
- Using Our Community
-
- Cloud Lab Forums
-
- Knowledge Bases
- ARM Microcontrollers
- i.MX Processors
- Identification and Security
- Model-Based Design Toolbox (MBDT)
- QorIQ Processing Platforms
- S32 Automotive Processing Platform
- Wireless Connectivity
- CodeWarrior
- MCUXpresso Suite of Software and Tools
- MQX Software Solutions
- RFID / NFC
- Advanced Analog
-
- NXP Tech Blogs
- Home
- :
- 软件论坛
- :
- S32 Design Studio知识库
- :
- HOWTO: Create S32DS Project from Example 'Hello World' for S32K144 (w/o SDK)
HOWTO: Create S32DS Project from Example 'Hello World' for S32K144 (w/o SDK)
HOWTO: Create S32DS Project from Example 'Hello World' for S32K144 (w/o SDK)
HOWTO: Create S32DS Project from Example 'Hello World' for S32K144 (w/o SDK)
Included in the S32DS for ARM is a set of example projects, which include one called 'hello'. This example shows a basic application which activates an LED when a button is pressed on the S32K144EVB-Q100 evaluation board. The S32K SDK is not used in this example.
In this HOWTO, we will show how to load the project into the workspace, build, download to the target, and run debug.
1. Create Project
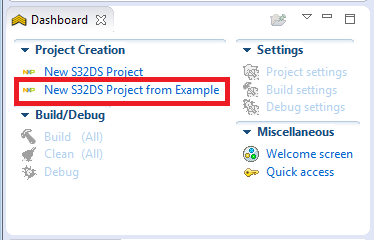
a. File -> New -> New S32DS Project from Example
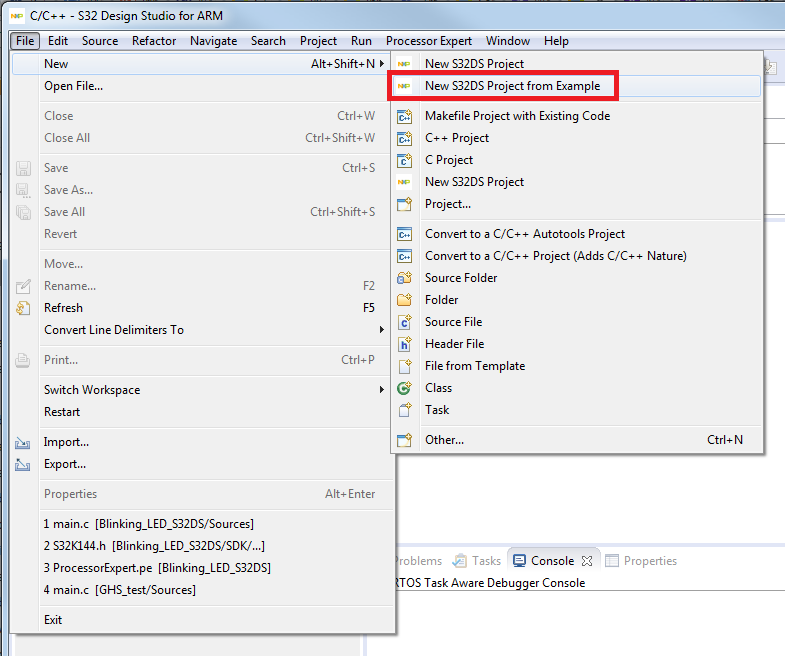
OR from the Dashboard
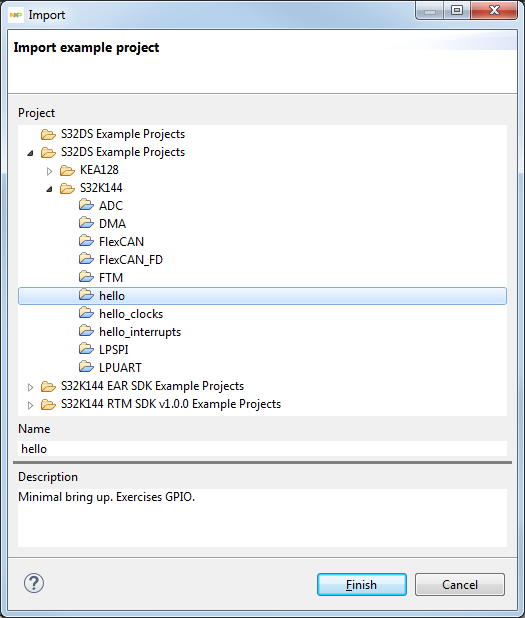
b. Select S32DS Example Projects -> S32K144 -> hello
2. Examine the code
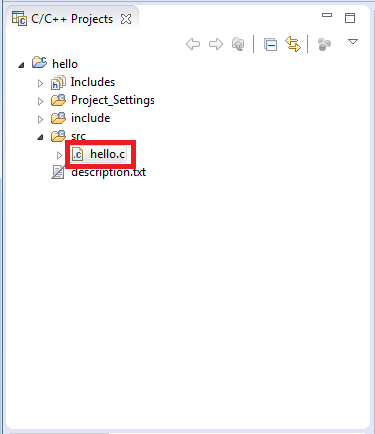
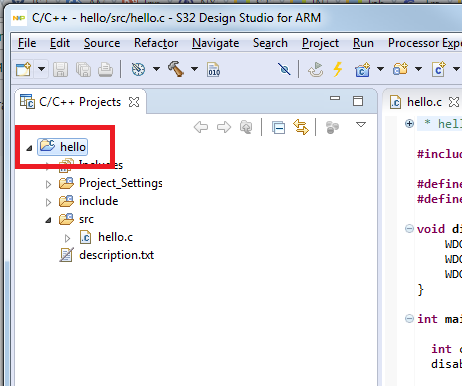
a. Locate the project in C/C++ Projects view
b. Expand 'hello', then 'src'
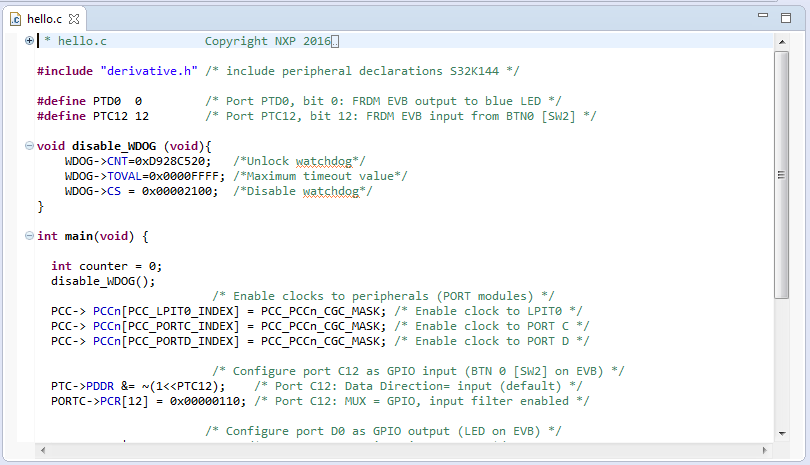
c. Double-click on 'hello.c', to open the file in the editor
3. Build the project
a. Click to select hello project, this is to ensure that the tool knows which project you wish to build.
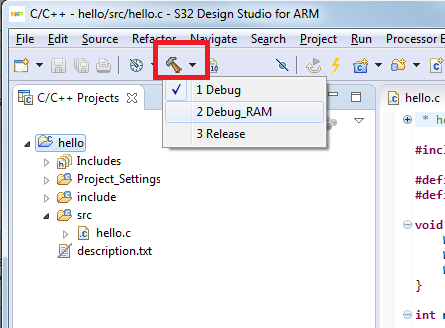
b. Click Build button. By default, the standard 'Debug' build configuration will be used. Projects created using either the New S32DS Project from Example, or New S32DS Project wizard are setup with 3 build configurations: Debug, Debug_RAM, and Release. The 'Debug' configuration contains settings to build the project with the lowest compiler optimization setting and to occupy the Flash memory space on the target. The 'Debug_RAM' configuration is very similar to the 'Debug' configuration with one exception. It is set to occupy the RAM memory space on the target. The 'Release' configuration will build the project with the highest optimization setting and to occupy the Flash memory space on the target.
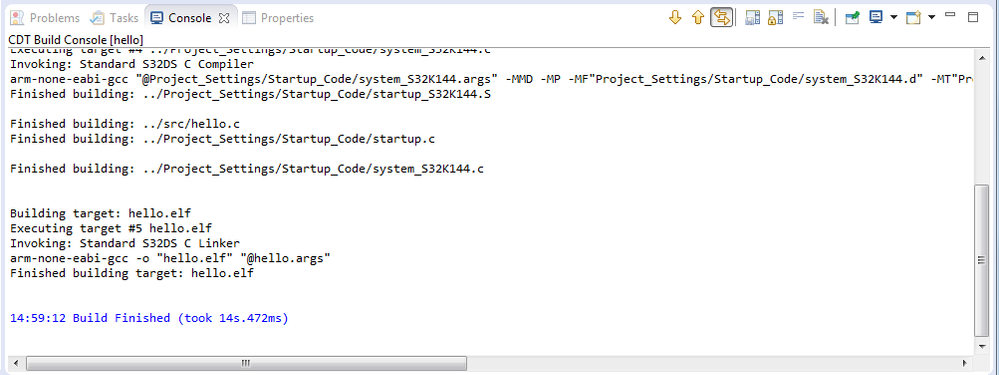
c. From the console tab, the build status output is displayed. Check here to confirm the build completed and there were no errors.
4. Setup Debug Configuration
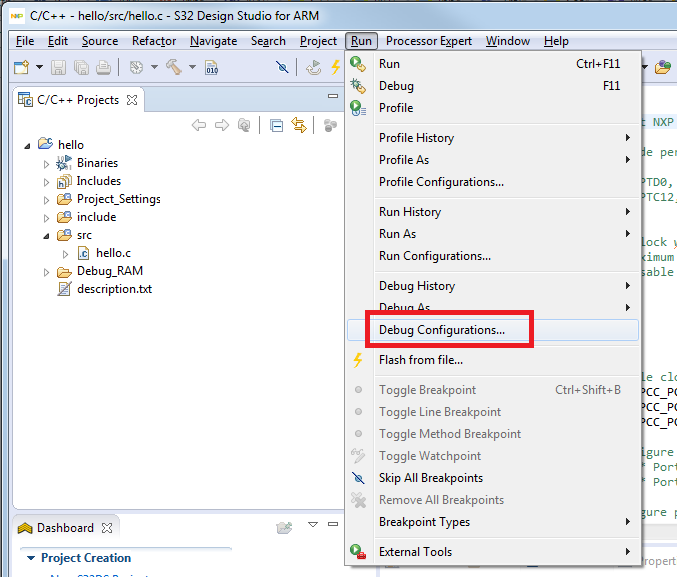
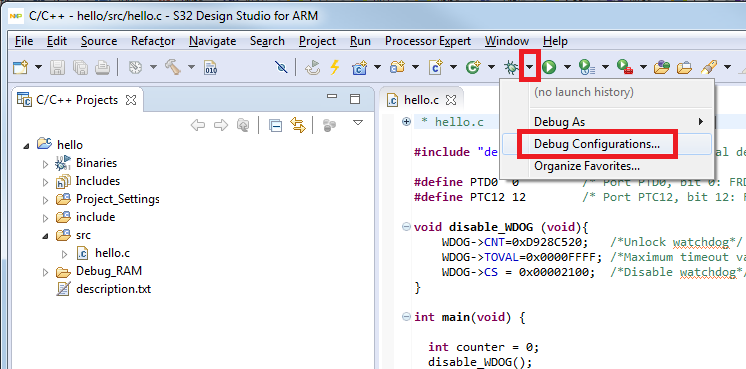
a. Click Run -> Debug Configurations… OR from the Debug button menu
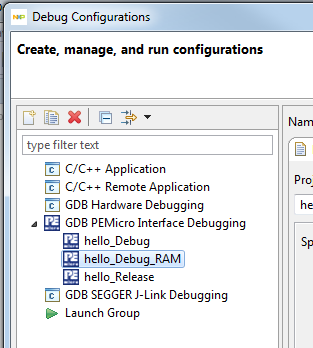
b. Expand the 'GDB PEMicro Interface Debugging' group.
c. Select the configuration which matches the build configuration you just used to build the project. For each build configuration generated by the new project wizard, it also generates a matching debug configuration.
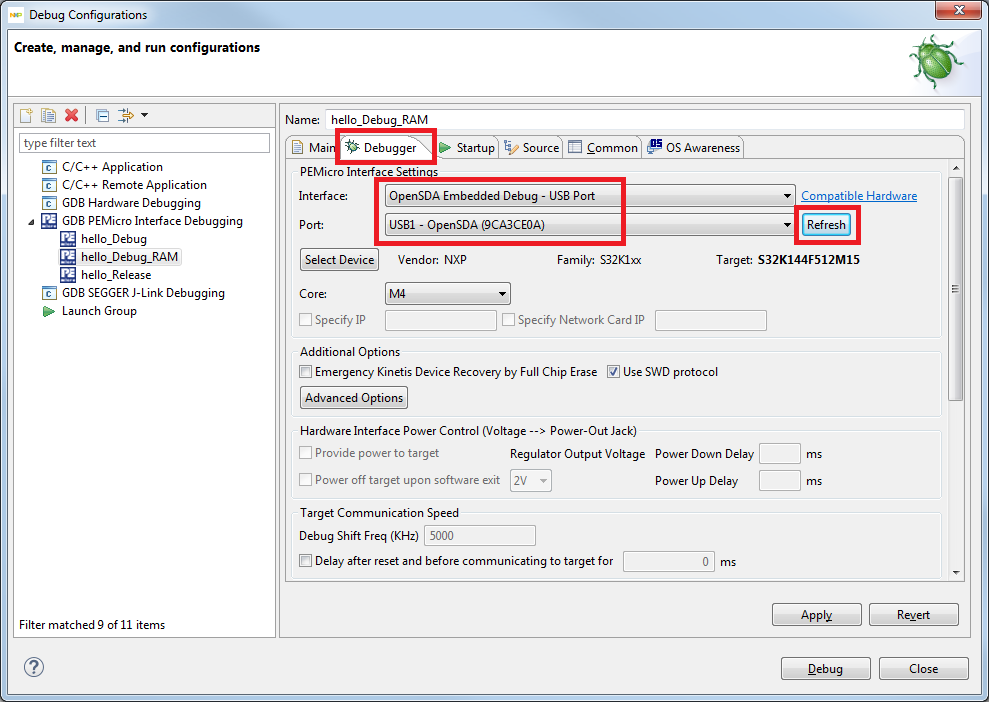
d. Select the Debugger tab. The debug configuration was created with the 'PE Micro GDB server' option selected, but there are several hardware options for this. Select the option which matches your hardware setup. For example, for the S32K144, most likely you have the standard evaluation board, which has OpenSDA integrated. In this case, you would use the OpenSDA interface option. For other MCUs, you may have hardware which requires the USB Multilink or Cyclone.
e. Click Refresh to ensure the correct port is selected.
5. Click Debug to start the debugger launch sequence. It is not necessary to click on the 'Apply' button unless setting changes are being made without intention to launch the debugger. The scripts behind the Debug button include the actions of the script behind the Apply button.
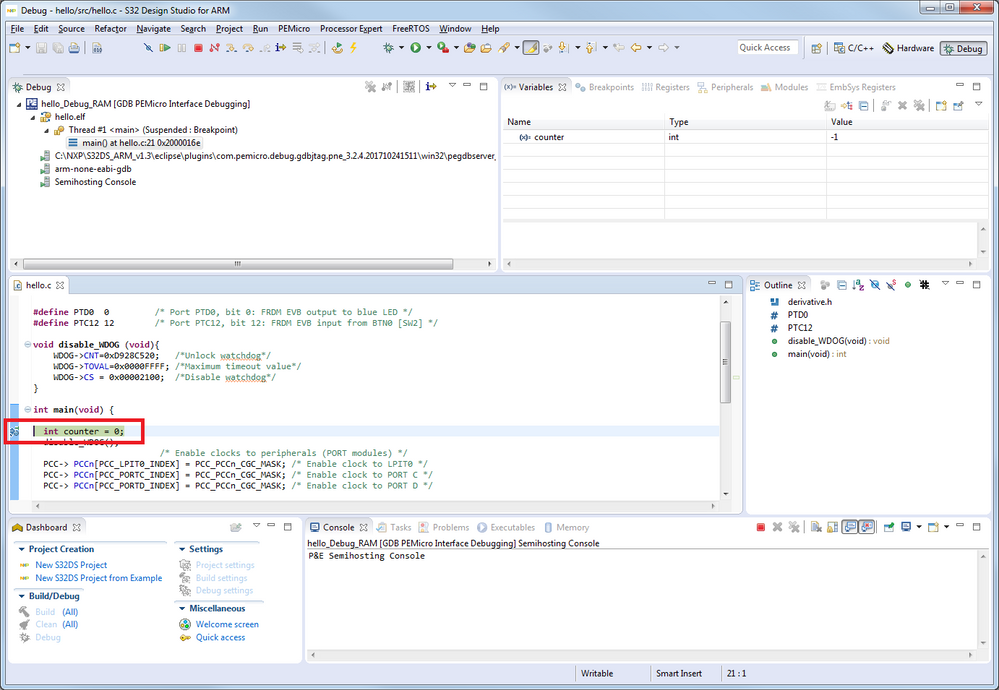
6. When the launch sequence completes, the application is executed until the start of main(), where a breakpoint was automatically set.
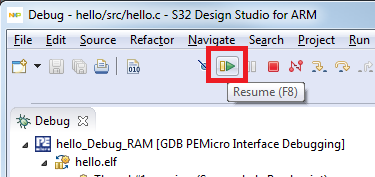
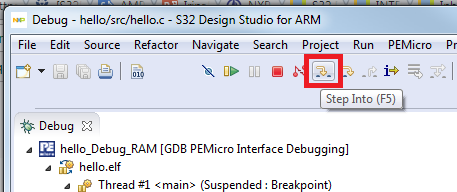
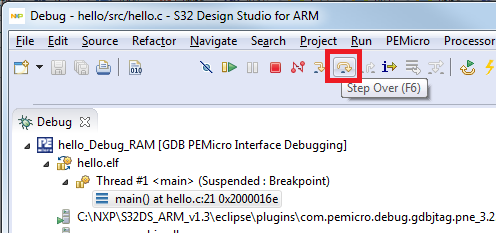
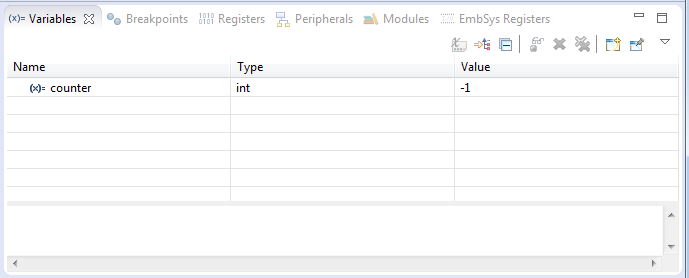
7. It is now possible to run or step through the code, view variables and registers.
8. Click Resume and when Button 0 is pressed, the LED will turn on as Blue, and when Button 0 is released, the LED turns off.
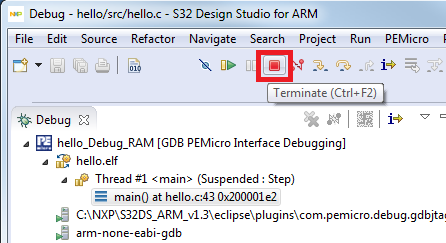
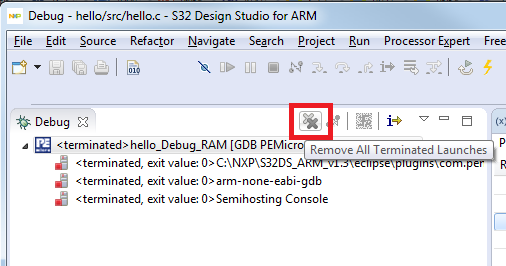
9. To end the debug session, click the 'Terminate' button. It is a good idea to also click on 'Remove All Terminated Launches', before starting another debug session.
Hello Mike,
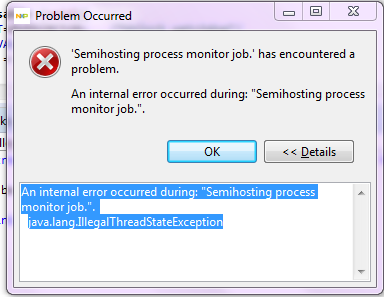
I am trying to debug the same project in the same manner mentioned above. Till Step 5 I am following the same steps but when I am clicking on debug one popup is issue is coming which is given below.
----- An internal error occurred during: "Semihosting process monitor job.".
----- java.lang.IllegalThreadStateException
Can you please provide your feedback what is this problem about. Thanks in advance.
Thanks & Regards,
Harpal Singh Jaswal
Hello Harpal Singh Jaswal,
To better diagnose this issue, we will need a few additional details from you. Could you please provide the following:
1. The version and build of S32 Design Studio you are using
2. The name of the example project you are attempting to debug (you indicated you were following the HOWTO, but we need to confirm)
3. Any Console window output which is relevant to this error.
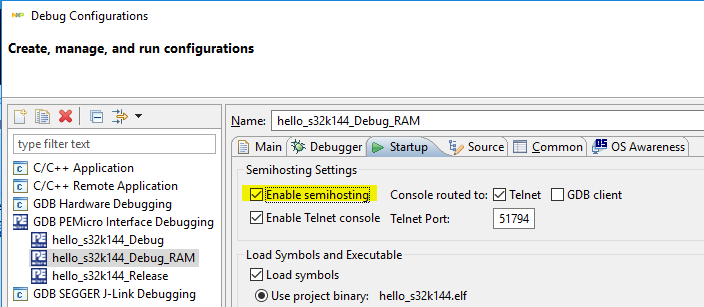
I also ask you to try disabling the semihosting. This can be done easily from the 'startup' tab in the Debug Configurations menu for the debug configuration you are attempting to excute. Likely 'hello_s32k144_Debug_RAM'. Uncheck the box next to 'Enable semihosting'.
Since the semihosting feature is not used in this example project, it should not affect the debugging experience but should eliminate the error preventing your progress. It is possible you have a conflict between the resources used by semihosting and some other process executing on your PC.
Please reply with your result.
Regards,
Mike
Hello Mike,
Thanks for your comments.
Please find the details given below.
1. The version and build of S32 Design Studio you are using--------->> I am Using Version 2.0 and version 1.3 (for both version same issue is coming)
2. The name of the example project you are attempting to debug (you indicated you were following the HOWTO, but we need to confirm)-------->> I am attempting S32K144 " Hello" project
3. Any Console window output which is relevant to this error.------>>Semihosting Console window
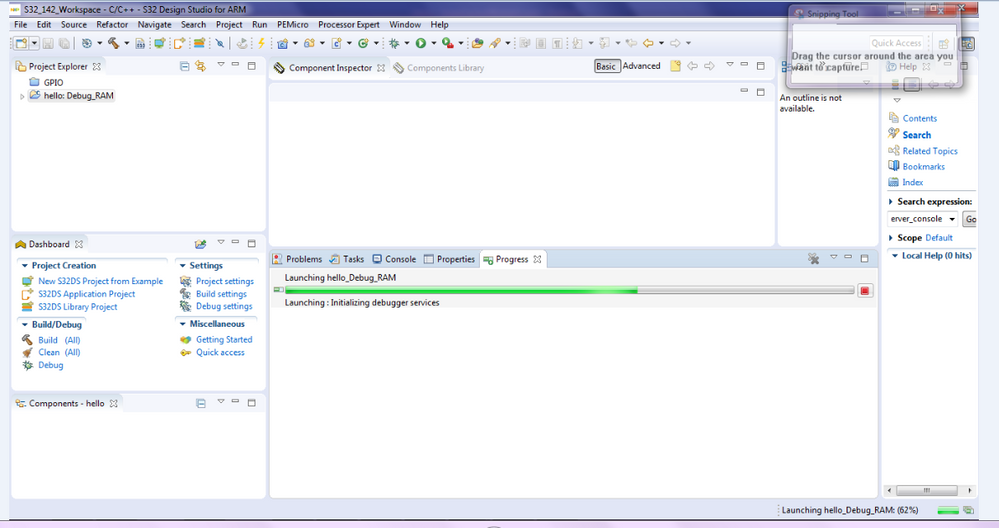
And you suggested to disable semihosting, after disabling semihosting "Launching: Initializing debugger services" is getting stuck at 62% and it is not progressing. And one more thing I want to add in my previous comment this same "Launching: Initializing debugger services" was getting stuck at 62% only. Please find the below snapshot for reference.
Thanks & Regards,
Harpal Singh Jaswal
Hello Harpal Singh Jaswal,
It seems you have old versions of the S32 Design Studio for ARM. We recommend that you use the latest version, 2018.R1, as it may contain updates which could resolve this issue. Please install and try the latest version and report if you experience any change in result.
You indicate that the Semihosting Console Window contains some output which could be relevant to this issue, but I did not see the output included in your response. Could you please provide this output.
Could you please provide some more background on your experience? I would like to know if this is the first time using S32 Design Studio and if you have worked with the S32K144 evaluation board before? Are you using the S32K144EVB-Q100 evaluation board? There are some other EVBs for this MCU, so it is important to confirm.
Have you or any of your colleagues had success in using the evaluation board which you connected to your PC in following this HOWTO example? How did you connect it; via USB or via P&E Multilink (JTAG connector)?
When you first powered up the evaluation board, did you see the LED blinking? These boards are shipped with some software pre-loaded and should cause the LED to blink when connected to a power source. If it does not, this could be a sign you have an older one and perhaps it has older firmware which interferes with the debug connection. If you are not the first to use this board, then it is possible that another user has overwritten the software which was preloaded and this could also cause the LED to not blink, but should not affect your ability to connect debug.
Did you also purchase the DEVKIT-MOTORGD device and connect it to the S32K144EVB-Q100? Connecting this device could affect your setup for this HOWTO example.
Regards,
Mike
Hello Harpal Singh Jaswal,
If the LEDs do not blink on the evaluation board when connected via USB or power connecter, then you can try to update the firmware. Here is a HOWTO with instructions on how to do this: https://community.nxp.com/docs/DOC-340263
Regards,
Mike
Hello Mike Doidge and Harpal Singh Jaswal,
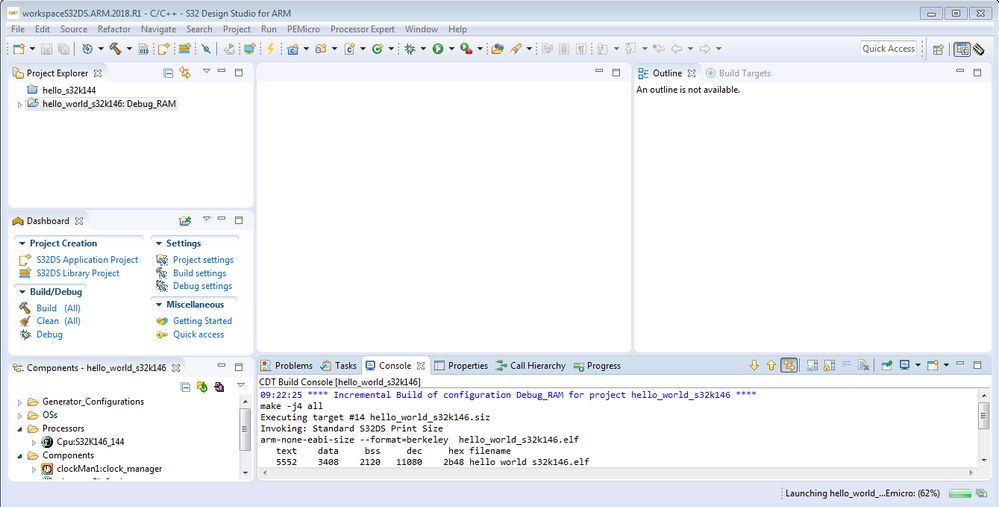
I have the same problem (stuck at 62%). I use the latest S32 Design Studio (2018.R1) with S32K146EVB. I updated the OpenSDA Firmware.
Please any suggestions. Thanks
Alex
Hi Mike & Alex,
This issue is related to Admin rights because of some admin restrictions it is stucking at 62%, Alex Please open your S32 Design Studio with admin rights. And I think this is not an issue with any S32 Design Studio. My issue got resolved when i had opened my S32 Design Studio with Admin Rights.
Thanks & Regards,
Harpal Singh Jaswal
Hi Harpal Singh Jaswal,
Thanks for the tip, it works!
With best Regards,
Alex
Welcome Alex :smileyhappy:
Thanks & Regards,
Harpal Singh Jaswal
