- Forums
- Product Forums
- General Purpose MicrocontrollersGeneral Purpose Microcontrollers
- i.MX Forumsi.MX Forums
- QorIQ Processing PlatformsQorIQ Processing Platforms
- Identification and SecurityIdentification and Security
- Power ManagementPower Management
- Wireless ConnectivityWireless Connectivity
- RFID / NFCRFID / NFC
- Advanced AnalogAdvanced Analog
- MCX Microcontrollers
- S32G
- S32K
- S32V
- MPC5xxx
- Other NXP Products
- S12 / MagniV Microcontrollers
- Powertrain and Electrification Analog Drivers
- Sensors
- Vybrid Processors
- Digital Signal Controllers
- 8-bit Microcontrollers
- ColdFire/68K Microcontrollers and Processors
- PowerQUICC Processors
- OSBDM and TBDML
- S32M
- S32Z/E
-
- Solution Forums
- Software Forums
- MCUXpresso Software and ToolsMCUXpresso Software and Tools
- CodeWarriorCodeWarrior
- MQX Software SolutionsMQX Software Solutions
- Model-Based Design Toolbox (MBDT)Model-Based Design Toolbox (MBDT)
- FreeMASTER
- eIQ Machine Learning Software
- Embedded Software and Tools Clinic
- S32 SDK
- S32 Design Studio
- GUI Guider
- Zephyr Project
- Voice Technology
- Application Software Packs
- Secure Provisioning SDK (SPSDK)
- Processor Expert Software
- Generative AI & LLMs
-
- Topics
- Mobile Robotics - Drones and RoversMobile Robotics - Drones and Rovers
- NXP Training ContentNXP Training Content
- University ProgramsUniversity Programs
- Rapid IoT
- NXP Designs
- SafeAssure-Community
- OSS Security & Maintenance
- Using Our Community
-
- Cloud Lab Forums
-
- Knowledge Bases
- ARM Microcontrollers
- i.MX Processors
- Identification and Security
- Model-Based Design Toolbox (MBDT)
- QorIQ Processing Platforms
- S32 Automotive Processing Platform
- Wireless Connectivity
- CodeWarrior
- MCUXpresso Suite of Software and Tools
- MQX Software Solutions
- RFID / NFC
- Advanced Analog
-
- NXP Tech Blogs
- Home
- :
- モデルベース・デザイン・ツールボックス(MBDT)
- :
- モデルベース・デザイン・ツールボックス(MBDT)
- :
- Re: How do I use the Profiler Function correctly?
How do I use the Profiler Function correctly?
- RSS フィードを購読する
- トピックを新着としてマーク
- トピックを既読としてマーク
- このトピックを現在のユーザーにフロートします
- ブックマーク
- 購読
- ミュート
- 印刷用ページ
- 新着としてマーク
- ブックマーク
- 購読
- ミュート
- RSS フィードを購読する
- ハイライト
- 印刷
- 不適切なコンテンツを報告
Hello,
I am using the NXP MBDT(Matalb 2017b, Toolboxversion: 4.1.0, S32K144EVB-Q100) and tried to use the Profiler Function. Attached you can find my simulink model. In that model I tried to test the Profiler Function by implementing a for-loop and measured an execution time of 3319 bus clock ticks. Then I copied the Matlab Function and expected an execution time which is twice as high. But then the FreeMASTER wasn't able to show the variable anymore it just appeared a question mark in the Variable Watch. Therefore I sent the execution time as a CAN-message using the FCAN-Send block. I measured an execution time of 187012 bus clock ticks. How is that possible? I expected a value between 6000 and 7000. Why did the FreeMASTER brake up I didn't change the configuration. Since I am already asking is it correct that the bus clock has in my model a frequency of 40MHz?
Any help on this issue would be highly appreciated!
Thanks in advance!
解決済! 解決策の投稿を見る。
- 新着としてマーク
- ブックマーク
- 購読
- ミュート
- RSS フィードを購読する
- ハイライト
- 印刷
- 不適切なコンテンツを報告
To make an update here - following up the discussion in this thread MBDT blocks for measuring Idle Time or ProcessorLoad , I realized I have made some mistakes in the answer i previously gave - to correct them, we have the following:
To get the execution time, you should get the number returned by the profiler block (that has frequency of 20MHz) and divide it to this exact frequency to get the result expressed into seconds.
Execution time = profiler ticks / 20 000 000
You can also convert from profiler ticks to core ticks by multiplying this number by 4.
Core ticks = profiler ticks x 4
The period will remain the same, but now you’ll have the following:
Execution time = (profiler ticks x 4) / (20MHz x 4)
As you can see, as both the nominator and the denominator have been multiplied by the same constant, if you simplify this, you’ll end up with the first formula.
Kind regards,
Razvan.
- 新着としてマーク
- ブックマーク
- 購読
- ミュート
- RSS フィードを購読する
- ハイライト
- 印刷
- 不適切なコンテンツを報告
It is working and we are using for our models, thanks.
I mistakenly didnt't select ataomic subsystem and resuable function at packaging for another new model and I saw just the outermost's profiler result which is overall model profiler actually. Then I select atomic subsystem and reusable for all subsytems and recalculate, this time I could see every substems' profiler but the overall execution time is increased a lot. Do you know the theory behind? Does atomic subsytem or resuable packaging increase the execution time?
Thanks
- 新着としてマーク
- ブックマーク
- 購読
- ミュート
- RSS フィードを購読する
- ハイライト
- 印刷
- 不適切なコンテンツを報告
Hello praktikant2fs3551.scw@zf.com,
The clock source for the profiler is actually SPLL/4, so 20MHz. So if you want to convert from profiling cycles (LPIT cycles) to core clock cycles, you can multiply by 4 the value that you get from the profiler block.
If you want to convert from profiling cycles to microseconds, you can divide by value (in MHz) and then divide by 4 (because it’s 4 times slower than the core).
e.g.: Let’s say we have a simple function for which the profiler returns the value 22 cycles. In this scenario we have core frequency = 80MHz.
22 cycles / 80 MHz / 4 = ~0.069 us. If we’d had 112MHz core speed selected, it would have taken 22 cycles / 112MHz / 4 = ~0.049us.
For this example, it takes 22 * 4 = 88 CPU cycles.
Tested on your example, I got the following values:
- 88469 profiler (PIT) bus clock ticks - for 1 subsystem (1 for loop) - 88469 / 80 / 4 = ~276us
- 177736 profiler (PIT) bus clock ticks - for 2 subsystems (2 for loops) - 177736 / 80 / 4 = ~555.4us
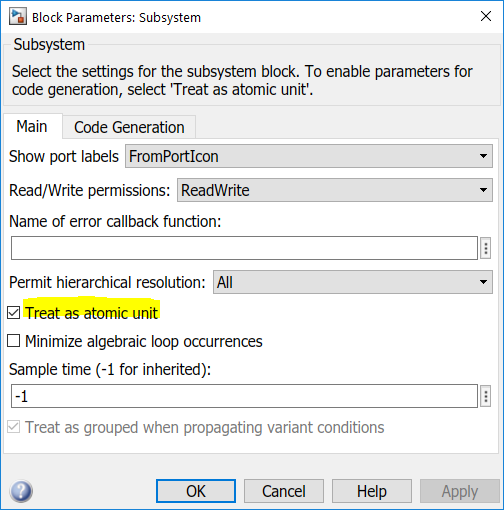
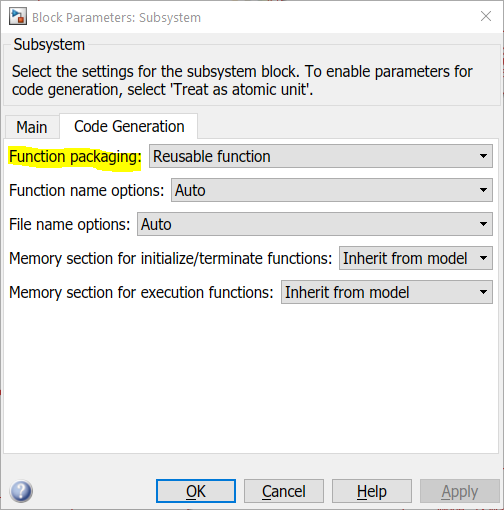
What you'll have to know for using the profiler block is that in some cases you'll have to set the subsystem as an atomic unit. You can do this by right clicking the subsystem you want to profile, click on Block parameters and from there select (in the Main tab) "Treat as atomic unit" + from Code generation tab "Function packaging: Reusable function" (or nonreusable, but NOT inline). You have to do this so that you only profile code within that subsystem. These settings make sure a function is generated for the subsystem and no other code is being generated (from blocks outside that subsystem). A subsystem is just a means for users to encapsulate certain parts of models; until you set it as an atomic unit, Simulink treats it like it is just dumped into the top model (all the blocks inside). Only after this setting is done, the encapsulation takes place.
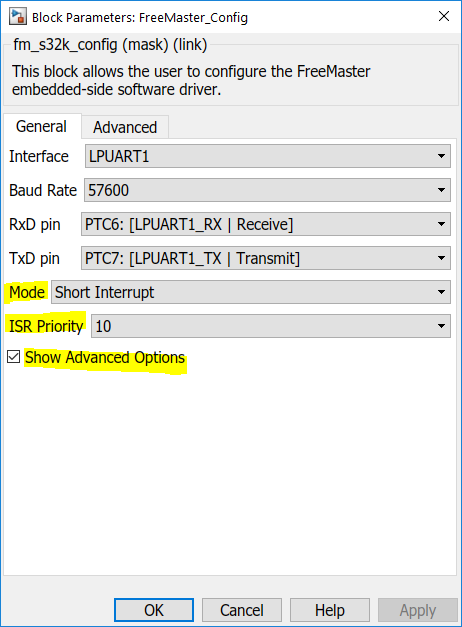
Another topic I'd like to address is FreeMASTER - you can go to the FreeMASTER configuration block and open the advanced settings. Here you'll see 3 modes available:
- Poll-driven - here no interrupt is needed/generated - this is generally not the way you'd like to configure, as the FreeMASTER can get starved and not complete the data transfer to the PC
- Long interrupt - all the message processing is done inside the interrupt
- Short interrupt - the data is saved and queued inside the interrupt - this is generally the mode you'd like to select, as you should always get data out and into the PC application
If you configure the FreeMASTER like in the image below, you'd get stable connection (no '??' data). The only downside to using short interrupt is that data is not instantly transmitted to the application (but the delays are negligible).
Hope this helps! Please let us know if you have further issues/questions.
Kind regards,
Razvan.
- 新着としてマーク
- ブックマーク
- 購読
- ミュート
- RSS フィードを購読する
- ハイライト
- 印刷
- 不適切なコンテンツを報告
To make an update here - following up the discussion in this thread MBDT blocks for measuring Idle Time or ProcessorLoad , I realized I have made some mistakes in the answer i previously gave - to correct them, we have the following:
To get the execution time, you should get the number returned by the profiler block (that has frequency of 20MHz) and divide it to this exact frequency to get the result expressed into seconds.
Execution time = profiler ticks / 20 000 000
You can also convert from profiler ticks to core ticks by multiplying this number by 4.
Core ticks = profiler ticks x 4
The period will remain the same, but now you’ll have the following:
Execution time = (profiler ticks x 4) / (20MHz x 4)
As you can see, as both the nominator and the denominator have been multiplied by the same constant, if you simplify this, you’ll end up with the first formula.
Kind regards,
Razvan.


