- Forums
- Product Forums
- General Purpose MicrocontrollersGeneral Purpose Microcontrollers
- i.MX Forumsi.MX Forums
- QorIQ Processing PlatformsQorIQ Processing Platforms
- Identification and SecurityIdentification and Security
- Power ManagementPower Management
- Wireless ConnectivityWireless Connectivity
- RFID / NFCRFID / NFC
- Advanced AnalogAdvanced Analog
- MCX Microcontrollers
- S32G
- S32K
- S32V
- MPC5xxx
- Other NXP Products
- S12 / MagniV Microcontrollers
- Powertrain and Electrification Analog Drivers
- Sensors
- Vybrid Processors
- Digital Signal Controllers
- 8-bit Microcontrollers
- ColdFire/68K Microcontrollers and Processors
- PowerQUICC Processors
- OSBDM and TBDML
- S32M
- S32Z/E
-
- Solution Forums
- Software Forums
- MCUXpresso Software and ToolsMCUXpresso Software and Tools
- CodeWarriorCodeWarrior
- MQX Software SolutionsMQX Software Solutions
- Model-Based Design Toolbox (MBDT)Model-Based Design Toolbox (MBDT)
- FreeMASTER
- eIQ Machine Learning Software
- Embedded Software and Tools Clinic
- S32 SDK
- S32 Design Studio
- GUI Guider
- Zephyr Project
- Voice Technology
- Application Software Packs
- Secure Provisioning SDK (SPSDK)
- Processor Expert Software
- Generative AI & LLMs
-
- Topics
- Mobile Robotics - Drones and RoversMobile Robotics - Drones and Rovers
- NXP Training ContentNXP Training Content
- University ProgramsUniversity Programs
- Rapid IoT
- NXP Designs
- SafeAssure-Community
- OSS Security & Maintenance
- Using Our Community
-
- Cloud Lab Forums
-
- Knowledge Bases
- ARM Microcontrollers
- i.MX Processors
- Identification and Security
- Model-Based Design Toolbox (MBDT)
- QorIQ Processing Platforms
- S32 Automotive Processing Platform
- Wireless Connectivity
- CodeWarrior
- MCUXpresso Suite of Software and Tools
- MQX Software Solutions
- RFID / NFC
- Advanced Analog
-
- NXP Tech Blogs
- Home
- :
- MQX Software Solutions
- :
- MQX Software Solutions
- :
- Debugger doesn't work after code location changed
Debugger doesn't work after code location changed
- Subscribe to RSS Feed
- Mark Topic as New
- Mark Topic as Read
- Float this Topic for Current User
- Bookmark
- Subscribe
- Mute
- Printer Friendly Page
- Mark as New
- Bookmark
- Subscribe
- Mute
- Subscribe to RSS Feed
- Permalink
- Report Inappropriate Content
Hi:
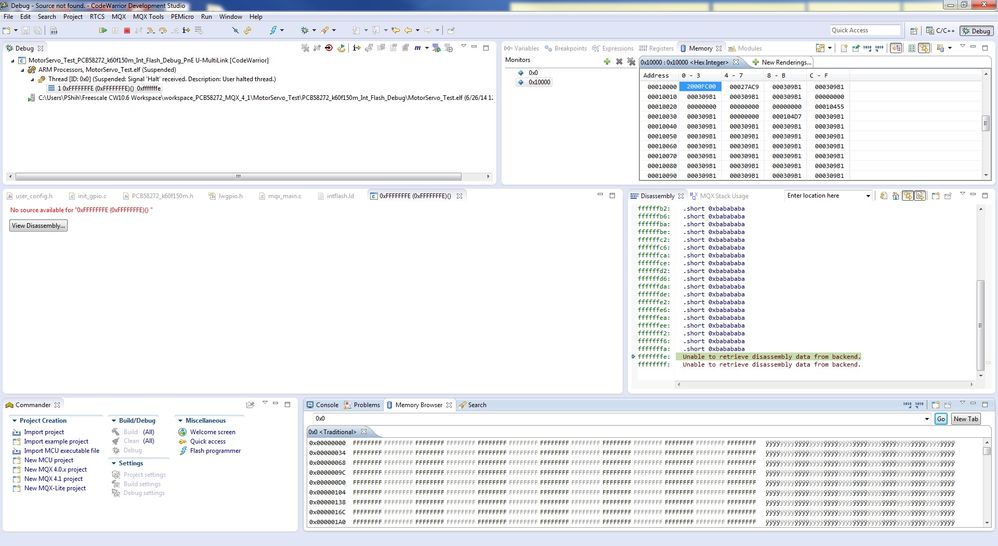
I have developed my application based on the K60 MCU (MK60FN1M0VLQ15) with MQX 4.1 on a custom board. All BSP, libraries, application have been developed well and all peripherals on a custom board are running OK. I am ready to modify linker file to offset the code location in order to work with bootloader. I modified the "vectorrom (RX): ORIGIN = 0x00010000", "cfmprotrom (R): ORIGIN = 0x00010400" and "rom (RX): ORIGIN = 0x00010420" and compiled successfully. However, after I download the image through debugger. The debugger doesn't point to the right start address in RAM, and cannot run with debugger. I have verified the code are loaded at 0x10000 right address.
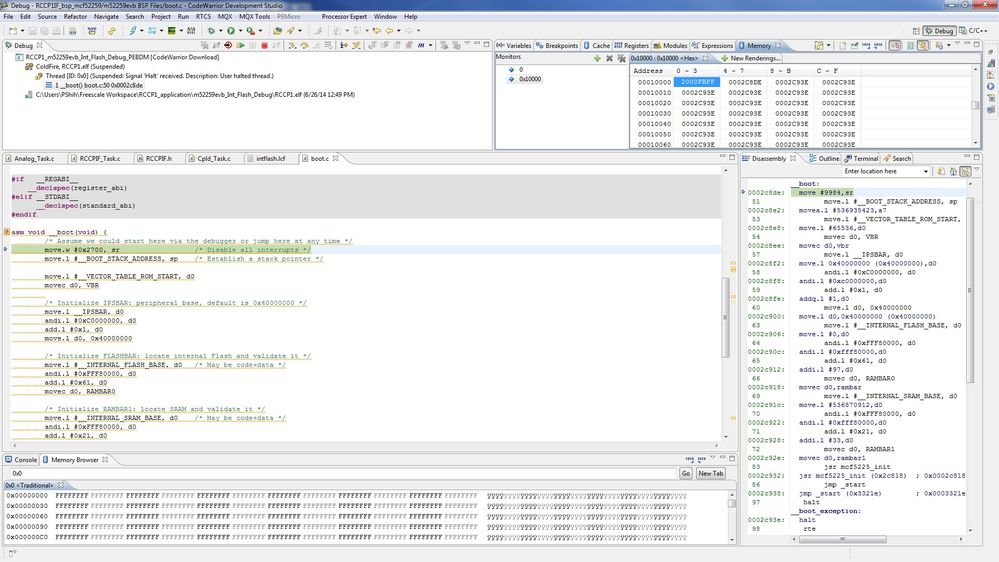
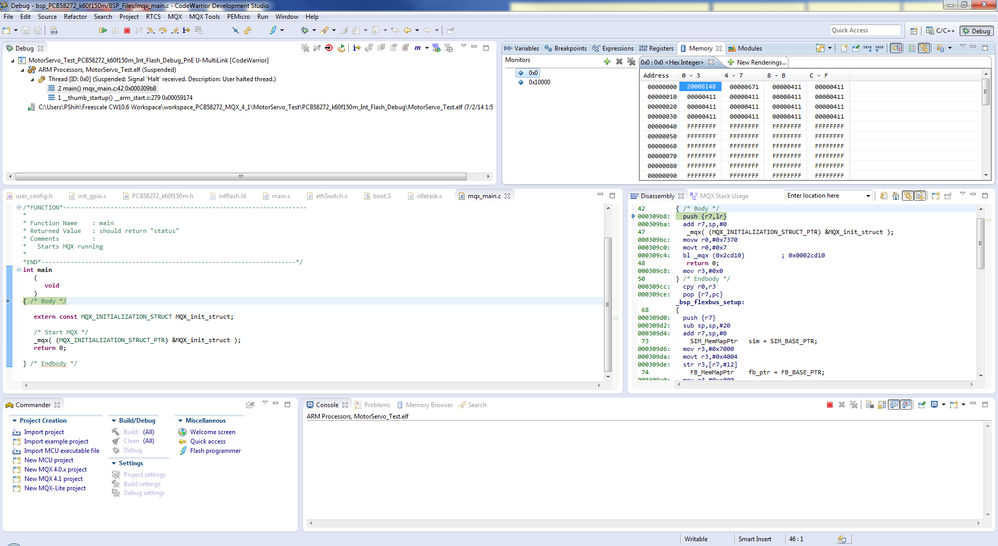
I worked with a similar project by using MCF52259 with MQX 3.8. The debugger was able to download my mcf52259 application at right ROM address and ready to run at the right RAM address. Please refer to the enclosed picture for detail.
I do have "#define MQX_ROM_VECTORS 0" set in the BSP "user_config.h". I don't know what I missed. Please advise me if you have any recommendation. Thanks!
Peter
Solved! Go to Solution.
- Mark as New
- Bookmark
- Subscribe
- Mute
- Subscribe to RSS Feed
- Permalink
- Report Inappropriate Content
Hi Peter,
This behavior is because the program counter will always look, coming from the reset, for the address 0x00000000 but does not find anything there because now you modified the linker adding an offset to the vector table of the application; and the debugger is not able to say to the program counter where are now the vectors of the application.
I recommend to you to develop and flash your bootloader in order to do not leave empty that address. Anyway this is not a problem with the application it is just a problem with the debugger. You can make the test to leave the vector table of your application in the address 0x00000000 and just modify the linker to move the rom section, where your code is, and now when you debug this program again you will not find problems.
I hope this information can help you.
Regards,
-----------------------------------------------------------------------------------------------------------------------
Note: If this post answers your question, please click the Correct Answer button. It would be nice!
-----------------------------------------------------------------------------------------------------------------------
- Mark as New
- Bookmark
- Subscribe
- Mute
- Subscribe to RSS Feed
- Permalink
- Report Inappropriate Content
Hi Peter
I am glad you found a solution.
I did not fully understand your change to the linker file. Do you leave the vector table from 0x0000_0000 to 0x0000_0400 and similarly the protection registers? Then you place your boot loader code in low memory and your application in high memory? I guess that would work and allow you to work with the debugger, but then for the final executable you would have to build for the correct configuration.
I don't know why IAR doesn't seem to have this problem, but we cause the linker to build the final application and we debug the same application. My guess is that the IAR system does preliminary setup through the debugging pod before jumping to the code, but that is a guess.
If you can please post the linker file and maybe this will be clear. I think you have found why we did not succeed with CW. Not being able to debug the final application is a bit disconcerting because of the potential for errors in distributing what is not a fully tested solution. It seems to me that CW should be able to remedy this if IAR can. Thanks
Robert
- Mark as New
- Bookmark
- Subscribe
- Mute
- Subscribe to RSS Feed
- Permalink
- Report Inappropriate Content
Hi Robert:
I didn't do any trick on application linker file. The only thing I did is shift image from 0x0 to 0x10000.
MEMORY
{
vectorrom (RX): ORIGIN = 0x00010000, LENGTH = 0x00000400
cfmprotrom (R) : ORIGIN = 0x00010400, LENGTH = 0x00000020
rom (RX): ORIGIN = 0x00010420, LENGTH = 0x000EEBE0 /* Code + Const data. The last 4K for position save data */
//vectorrom (RX): ORIGIN = 0x00000000, LENGTH = 0x00000400
//cfmprotrom (R) : ORIGIN = 0x00000400, LENGTH = 0x00000020
//rom (RX): ORIGIN = 0x00000420, LENGTH = 0x000EEBE0 /* Code + Const data. The last 4K for position save data */
ram (RW): ORIGIN = 0x1FFF0000, LENGTH = 0x00020000 /* SRAM - RW data */
/* kernel space starts after RAM variables (Location of MQX Kernel data + MQX heap) */
end_of_kd (RW): ORIGIN = 0x2000FFF0, LENGTH = 0x00000000
/* Boot stack reused by MQX Kernel data */
bstack (RW): ORIGIN = 0x2000FA00, LENGTH = 0x00000200 /* Boot stack */
end_bstack (RW): ORIGIN = 0x2000FC00, LENGTH = 0x00000000 /* Boot stack end address requires 4B alignment */
}
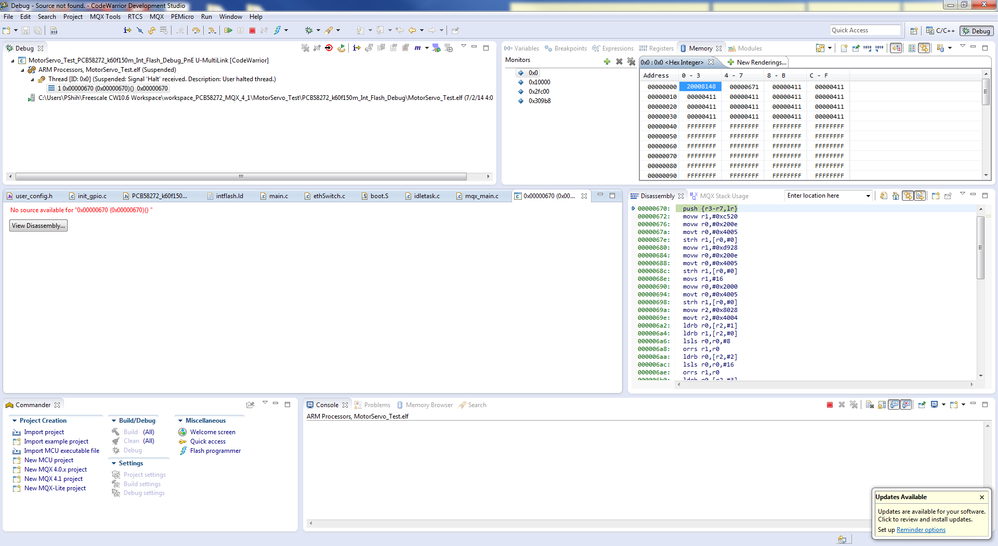
When I entering debug mode in the application development environment, the debugger runs to main() as you have seen in the above picture. Once I reset the debugger, it starts from 0x670, which is the entry point of bootloader: _main(). If you "Resume", eventually the debugger runs to the application code area through bootloader. I think the bootloader code residue at 0x0 is just like a jump board to the application code.
You may check you IAR system, and verify any code residue at 0x0 area. maybe IAR is smart enough to make a default bootloader if your application is not at 0x0. Let me know if you have any finding. Thanks!
Peter
- Mark as New
- Bookmark
- Subscribe
- Mute
- Subscribe to RSS Feed
- Permalink
- Report Inappropriate Content
Hi everyone:
Thanks your guys help.
This morning, I received the reply from Freescale Support. Basically, the reply is pretty much same as Adrian said as following without valid recommendation:
" When review the .ld file you attached, I saw that you have modify the start address of vectorrom from 0x0 to 0x00010000.
That is the root reason causing the problem on your side.
When Kinetis MCU power up, it will first access address 0x0 and read the address of power on/reset routine and then executing.
The is a fixed process and can't be change. So, when placing the vector 0 to other address than 0x0, the MCU will not find the right code to execute.
And, some flash register are placed from 0x400 to 0x420, so, memory range of "cfmportrom" is not allowed to change.
What you can do is just change "rom" address in the .ld file."
I have found and downloaded a useful "Serial Bootloader" from AN2295 (HC08/S08 Developer's Serial Bootloader) updated for rev. 9.2 - CF V1 (alpha) support added. With minimum modification, I was able to make this work on my target board. Then I flashed both bootloader and application with offset starting address into my target board by "Flush file to Target" through CW10.6. The system works fine.
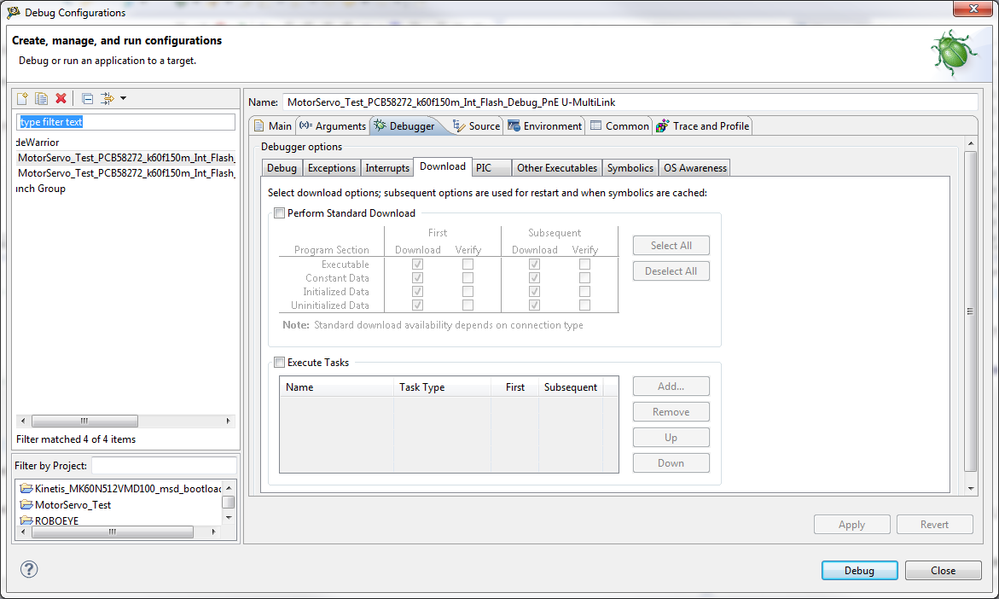
Back to application development, I also was able to enter debug mode without downloading image. Now I can debug my application with bootloader code residue at 0x0. You can refer to "Microcontroller_FAQ_Guide.pdf, 7.4 Flash Programmer" for detail.
The only drawback is I cannot make change and download it to my target. I have to either make debugger to erase and program application section only, or I have to combine both bootloader and application at post-process. You can refer to Re: K60 s19 file generation for detail. Again, thank you very much.
Peter
- Mark as New
- Bookmark
- Subscribe
- Mute
- Subscribe to RSS Feed
- Permalink
- Report Inappropriate Content
Hi Peter
For what it is worth, We had the exact same problem with the k20dx256vl10. I submitted an SR and FSL never solved the problem. A year later I resubmitted the same SR, after several months no resolution, we were bounced around to one simple example after another and the problem was never solved. So we switched to the IAR toolset, several thousands of dollars in expense but after 3 hours the project with the debugger worked.
I am not recommending you do that, but if you do solve this please post as I would also like to know the solution. What we found was that we could build the code at 0x0000 0000 and it worked correctly with the debugger. We moved the vector table to ram as you did, and then built the code to 0x0001 0000 and the code would work but the debugger would not. It did not find the symbol table.
Good luck
Robert
- Mark as New
- Bookmark
- Subscribe
- Mute
- Subscribe to RSS Feed
- Permalink
- Report Inappropriate Content
Thanks Robert.
This is a encourage news. At least for now, probably I can put this on the side and implement my bootloader first. Once I have it, I will be able to confirm my application.
Actually, I do submit a service ticket yesterday. I will keep posting whatever I have. However, after your story, I am not sure if I will get any good news. Bottom line, I may need different linker file for debug and release version. Again, thank you for replying.
Peter
- Mark as New
- Bookmark
- Subscribe
- Mute
- Subscribe to RSS Feed
- Permalink
- Report Inappropriate Content
Hi Peter,
This behavior is because the program counter will always look, coming from the reset, for the address 0x00000000 but does not find anything there because now you modified the linker adding an offset to the vector table of the application; and the debugger is not able to say to the program counter where are now the vectors of the application.
I recommend to you to develop and flash your bootloader in order to do not leave empty that address. Anyway this is not a problem with the application it is just a problem with the debugger. You can make the test to leave the vector table of your application in the address 0x00000000 and just modify the linker to move the rom section, where your code is, and now when you debug this program again you will not find problems.
I hope this information can help you.
Regards,
-----------------------------------------------------------------------------------------------------------------------
Note: If this post answers your question, please click the Correct Answer button. It would be nice!
-----------------------------------------------------------------------------------------------------------------------
