- Forums
- Product Forums
- General Purpose MicrocontrollersGeneral Purpose Microcontrollers
- i.MX Forumsi.MX Forums
- QorIQ Processing PlatformsQorIQ Processing Platforms
- Identification and SecurityIdentification and Security
- Power ManagementPower Management
- Wireless ConnectivityWireless Connectivity
- RFID / NFCRFID / NFC
- Advanced AnalogAdvanced Analog
- MCX Microcontrollers
- S32G
- S32K
- S32V
- MPC5xxx
- Other NXP Products
- S12 / MagniV Microcontrollers
- Powertrain and Electrification Analog Drivers
- Sensors
- Vybrid Processors
- Digital Signal Controllers
- 8-bit Microcontrollers
- ColdFire/68K Microcontrollers and Processors
- PowerQUICC Processors
- OSBDM and TBDML
- S32M
- S32Z/E
-
- Solution Forums
- Software Forums
- MCUXpresso Software and ToolsMCUXpresso Software and Tools
- CodeWarriorCodeWarrior
- MQX Software SolutionsMQX Software Solutions
- Model-Based Design Toolbox (MBDT)Model-Based Design Toolbox (MBDT)
- FreeMASTER
- eIQ Machine Learning Software
- Embedded Software and Tools Clinic
- S32 SDK
- S32 Design Studio
- GUI Guider
- Zephyr Project
- Voice Technology
- Application Software Packs
- Secure Provisioning SDK (SPSDK)
- Processor Expert Software
- Generative AI & LLMs
-
- Topics
- Mobile Robotics - Drones and RoversMobile Robotics - Drones and Rovers
- NXP Training ContentNXP Training Content
- University ProgramsUniversity Programs
- Rapid IoT
- NXP Designs
- SafeAssure-Community
- OSS Security & Maintenance
- Using Our Community
-
- Cloud Lab Forums
-
- Knowledge Bases
- ARM Microcontrollers
- i.MX Processors
- Identification and Security
- Model-Based Design Toolbox (MBDT)
- QorIQ Processing Platforms
- S32 Automotive Processing Platform
- Wireless Connectivity
- CodeWarrior
- MCUXpresso Suite of Software and Tools
- MQX Software Solutions
- RFID / NFC
- Advanced Analog
-
- NXP Tech Blogs
- Home
- :
- MCUXpresso软件和工具
- :
- MCUXpresso IDE
- :
- Re: LinkServer errors
LinkServer errors
LinkServer errors
I mentioned in another thread that I'm having new problems with the LPC-Link2 today. I'm creating this post to cover those.
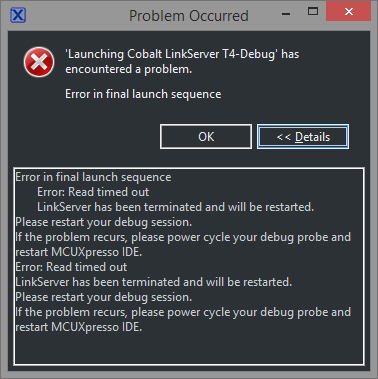
I changed nothing from yesterday's configuration; I left the system running overnight to try to catch a usage fault, caught it, and got an instruction trace. When trying to launch again, I started getting errors.
This continued after power cycling the target and the LPC-Link2, manually killing redlinkserver.exe since the cleanup button doesn't always do it, and restarting the IDE. I rebooted the system completely, power cycled everything again, and got the same thing. After power cycling the probe yet again, it's back to a different error:
Mind you, this is *after* successfully downloading the firmware image and starting it. I don't know what component this might be coming from. The target is running at this point, though.
It's *not* a problem with the connection to the target - I moved the cable from the LPC-Link2 to my Cyclone ACP without touching the end connected to the target, and the Cyclone runs fine. The P&E gdb software did automatically update this morning, but that was after the problems had started.
Any ideas?
Scott
The "Clean up Debug" button basically just kills all of the SEGGER, P&E and LinkServer related debug executables, including GDB. You should be able to see this if you have task manager running before you hit the button. The fact that you still see redlinkserv still running afterwards almost suggests that something in your environment is reopening it, though I can't think of why this might happen. Do you maybe have the redlinkserv console open in the IDE's console view?
With regards to the "Target not available" popup, this looks like it might be related to having the Disassembly View open at the time you start the debug session. Is this the case for you? Certainly in our investigation here, it looks like in such circumstances the underlying Eclipse functionality appears to be trying to access the target to populate the view before the debug connection is actually live. We'll investigate further to see if there is anything we can do to mask this in a future release, but otherwise the message is basically benign.
Regards,
MCUXpresso IDE Support
Do you maybe have the redlinkserv console open in the IDE's console view?
I just did a quick test and during a normal run if I terminate the session it closes redlinkserver.exe even if I have the console open. If I click cleanup while the session is still active it doesn't kill it. The problem with it not cleaning up happens when I lose the debug probe connection, usually while I'm chasing a hard fault or something. I frequently end up in that state, but sometimes I'm able to kill everything and launch an 'attach' configuration and it'll reconnect and let me get instruction traces and memory contents, so I know the target is OK.
Back on the topic of the target audience for MCUX, how much knowledge of gdb and the ARM Cortex debug components is expected of the typical user? I'm comfortable with make and gcc and know generally how MCUX handles its managed make system and how it works with the toolchain, but I don't have the same level of experience with gdb and I don't know if it's expected. I've worked mostly with MetroWerks, Microsoft, and Borland IDEs that didn't use gdb. I could probably remember some HC11 BUFFALO monitor commands, too. :smileywink:
it might be related to having the Disassembly View open at the time you start the debug session. Is this the case for you?
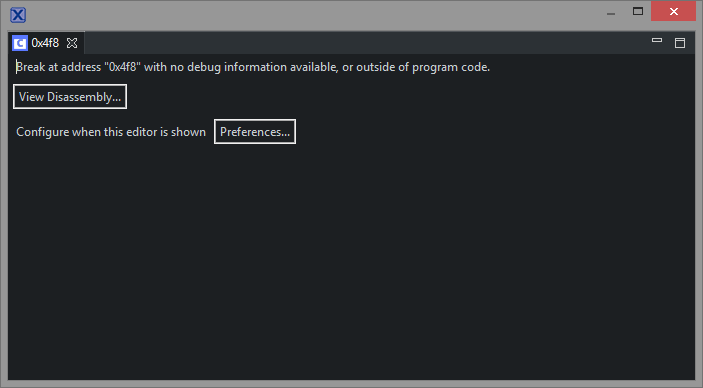
Since it's still running I think you're right, that it's just a timing problem. Like the fact that it almost always brings up at least one window like this every time it starts:
If it's benign I can live with it, though the little annoyances do add up. As Erich recently pointed out on his blog, the instruction trace config requires you to close and open the view to load saved settings, and I've pointed out places in the debug configuration dialogs before where you have to click one tab and come back to another to get a button to update. None of these stop you from using the features, you just have to remember the little dance you have to do for each one.
I know there's a trouble ticket system, but is there a public issue tracking system to report and document these problems, and avoid duplicate reports? I'd rather help make the tool better if I can, than just complain about stuff that's broken.


