- Forums
- Product Forums
- General Purpose MicrocontrollersGeneral Purpose Microcontrollers
- i.MX Forumsi.MX Forums
- QorIQ Processing PlatformsQorIQ Processing Platforms
- Identification and SecurityIdentification and Security
- Power ManagementPower Management
- Wireless ConnectivityWireless Connectivity
- RFID / NFCRFID / NFC
- Advanced AnalogAdvanced Analog
- MCX Microcontrollers
- S32G
- S32K
- S32V
- MPC5xxx
- Other NXP Products
- S12 / MagniV Microcontrollers
- Powertrain and Electrification Analog Drivers
- Sensors
- Vybrid Processors
- Digital Signal Controllers
- 8-bit Microcontrollers
- ColdFire/68K Microcontrollers and Processors
- PowerQUICC Processors
- OSBDM and TBDML
- S32M
- S32Z/E
-
- Solution Forums
- Software Forums
- MCUXpresso Software and ToolsMCUXpresso Software and Tools
- CodeWarriorCodeWarrior
- MQX Software SolutionsMQX Software Solutions
- Model-Based Design Toolbox (MBDT)Model-Based Design Toolbox (MBDT)
- FreeMASTER
- eIQ Machine Learning Software
- Embedded Software and Tools Clinic
- S32 SDK
- S32 Design Studio
- GUI Guider
- Zephyr Project
- Voice Technology
- Application Software Packs
- Secure Provisioning SDK (SPSDK)
- Processor Expert Software
- Generative AI & LLMs
-
- Topics
- Mobile Robotics - Drones and RoversMobile Robotics - Drones and Rovers
- NXP Training ContentNXP Training Content
- University ProgramsUniversity Programs
- Rapid IoT
- NXP Designs
- SafeAssure-Community
- OSS Security & Maintenance
- Using Our Community
-
- Cloud Lab Forums
-
- Knowledge Bases
- ARM Microcontrollers
- i.MX Processors
- Identification and Security
- Model-Based Design Toolbox (MBDT)
- QorIQ Processing Platforms
- S32 Automotive Processing Platform
- Wireless Connectivity
- CodeWarrior
- MCUXpresso Suite of Software and Tools
- MQX Software Solutions
- RFID / NFC
- Advanced Analog
-
- NXP Tech Blogs
- Home
- :
- MCUXpressoソフトウェアとツール
- :
- MCUXpresso IDE
- :
- LPC Link 2 Dual Debug Configurations
LPC Link 2 Dual Debug Configurations
- RSS フィードを購読する
- トピックを新着としてマーク
- トピックを既読としてマーク
- このトピックを現在のユーザーにフロートします
- ブックマーク
- 購読
- ミュート
- 印刷用ページ
- 新着としてマーク
- ブックマーク
- 購読
- ミュート
- RSS フィードを購読する
- ハイライト
- 印刷
- 不適切なコンテンツを報告
Hello,
I am using MCUXpresso IDE v10.0.2 with a Kinetis K64F processor. I have ported over the KSDK 1.3.0 version with MQX as the OS. We will not be migrating to KSDK 2.X series since MQX is no longer free.
I use the MQX TAD views since they are critical for viewing os performance. The only way this works with the LPCLink2 is if I use it in "all-stop" mode. However, we also like the "non-stop" feature of the LPCLink2 which is being able to view variables each second without having to pause program execution.
I would like to create 2 debug configurations for the LPCLink2: 1 in Non-Stop Mode, and 1 in All-Stop Mode.
Here is my procedure for creating these configurations.
- Remove all LPC Link 2 configurations from the project.
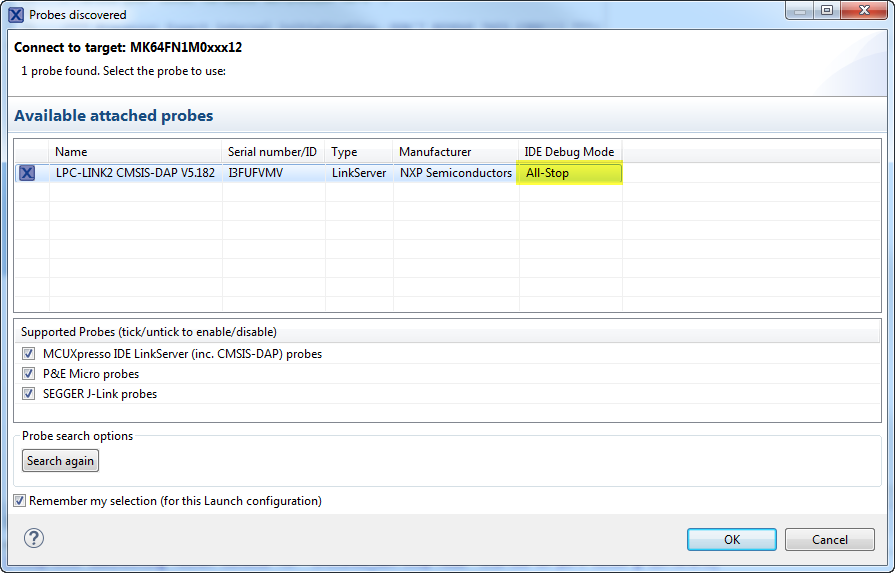
- Click the "Blue Bug" icon to automatically search for probes.
- From the "Probes Discovered" dialog, choose IDE Debug Mode --> All-Stop.
- Click Ok.
- The debug session starts and all is well.
- Stop debugging and go to LPCLink2 debug configurations.
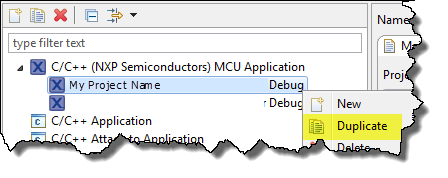
- Right-click on the configuration created automatically and select "Duplicate"
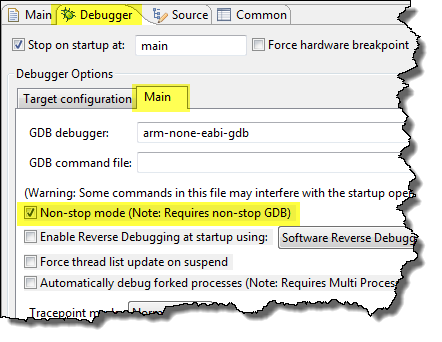
- On the duplicated configuration go to the Debugger Tab, Main, and check "Non-Stop Mode"
- Click Apply.
- Click Debug.
- The debug session will start and break at main like usual. However, when I press play I no longer have the "Pause" option available, it is grayed out.
- It does stop at breakpoints and I am able to step when it breaks, but I don't have the option to pause. Also, when I press the red "Terminate" button it does not actually disconnect from the target. In task manager arm-non-eabi-gdb.exe is still running. I have to restart MCUXpresso after killing the arm-none-eabi-gdb task to be able to debug again, or it says a session is already deployed.
Is there something else that needs to be changed when I copy over the configuration?
Once I have an LPCLink2 configuration and I press the blue debug icon it automatically launches the one I created instead of pulling up the probe discovery dialog.
解決済! 解決策の投稿を見る。
- 新着としてマーク
- ブックマーク
- 購読
- ミュート
- RSS フィードを購読する
- ハイライト
- 印刷
- 不適切なコンテンツを報告
Hi,
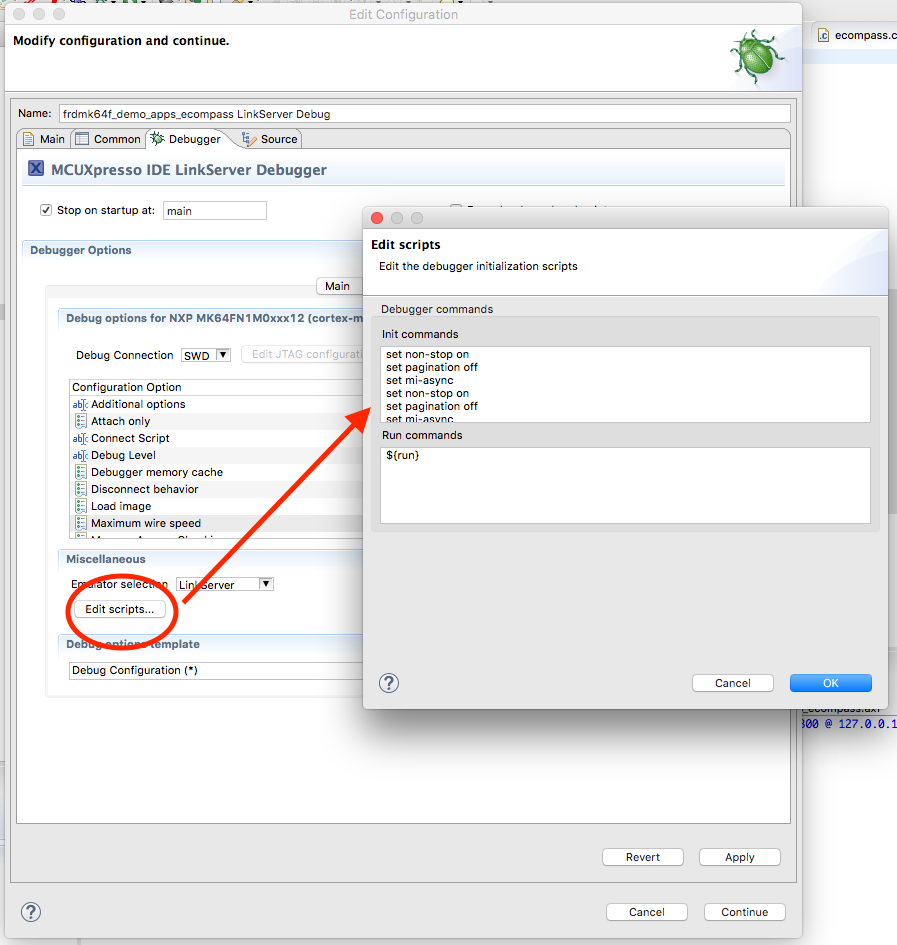
the NonStop mode needs the following commands in the GDB init section of your debugging configuration:
- set non-stop on
- set pagination off
- set mi-async
Regards,
MCUXpressoIDE Support Team
- 新着としてマーク
- ブックマーク
- 購読
- ミュート
- RSS フィードを購読する
- ハイライト
- 印刷
- 不適切なコンテンツを報告
Hi,
the NonStop mode needs the following commands in the GDB init section of your debugging configuration:
- set non-stop on
- set pagination off
- set mi-async
Regards,
MCUXpressoIDE Support Team
- 新着としてマーク
- ブックマーク
- 購読
- ミュート
- RSS フィードを購読する
- ハイライト
- 印刷
- 不適切なコンテンツを報告
Thank you. Debugging works as expected now.


