- Forums
- Product Forums
- General Purpose MicrocontrollersGeneral Purpose Microcontrollers
- i.MX Forumsi.MX Forums
- QorIQ Processing PlatformsQorIQ Processing Platforms
- Identification and SecurityIdentification and Security
- Power ManagementPower Management
- Wireless ConnectivityWireless Connectivity
- RFID / NFCRFID / NFC
- Advanced AnalogAdvanced Analog
- MCX Microcontrollers
- S32G
- S32K
- S32V
- MPC5xxx
- Other NXP Products
- S12 / MagniV Microcontrollers
- Powertrain and Electrification Analog Drivers
- Sensors
- Vybrid Processors
- Digital Signal Controllers
- 8-bit Microcontrollers
- ColdFire/68K Microcontrollers and Processors
- PowerQUICC Processors
- OSBDM and TBDML
- S32M
- S32Z/E
-
- Solution Forums
- Software Forums
- MCUXpresso Software and ToolsMCUXpresso Software and Tools
- CodeWarriorCodeWarrior
- MQX Software SolutionsMQX Software Solutions
- Model-Based Design Toolbox (MBDT)Model-Based Design Toolbox (MBDT)
- FreeMASTER
- eIQ Machine Learning Software
- Embedded Software and Tools Clinic
- S32 SDK
- S32 Design Studio
- GUI Guider
- Zephyr Project
- Voice Technology
- Application Software Packs
- Secure Provisioning SDK (SPSDK)
- Processor Expert Software
- Generative AI & LLMs
-
- Topics
- Mobile Robotics - Drones and RoversMobile Robotics - Drones and Rovers
- NXP Training ContentNXP Training Content
- University ProgramsUniversity Programs
- Rapid IoT
- NXP Designs
- SafeAssure-Community
- OSS Security & Maintenance
- Using Our Community
-
- Cloud Lab Forums
-
- Knowledge Bases
- ARM Microcontrollers
- i.MX Processors
- Identification and Security
- Model-Based Design Toolbox (MBDT)
- QorIQ Processing Platforms
- S32 Automotive Processing Platform
- Wireless Connectivity
- CodeWarrior
- MCUXpresso Suite of Software and Tools
- MQX Software Solutions
- RFID / NFC
- Advanced Analog
-
- NXP Tech Blogs
- Home
- :
- MCUXpresso软件和工具
- :
- MCUXpresso通用功能
- :
- Re: I can't force the PC (Program Counter) in a debug configuration.
I can't force the PC (Program Counter) in a debug configuration.
I relocated the vector table in an MCUXpresso v11.6 FreeRTOS project to 0x8000 (via the MCU Settings) so that I can add a bootloader later. However, I am now unable to debug this project--it complains that it can't find source code at 0xfffffffe and then crashes, even after I set the Program Counter to the function "ResetISR" in the Debug Configuration [PEMicro's "Set PC (absolute hex address or symbol)"]. I also tried setting it to ResetISR's location: "0x815D" and "815D".
I have successfully done this in CodeWarrior v10, years ago, but I even tried an MCUXpresso UART SDK example project and had the same results. Can someone try an SDK example on their machine, with the MCU Settings' PROGRAM_FLASH set to 0x8000, length = 0xF0000? Or am I missing something?
已解决! 转到解答。
Yes, your SP is not pointing to a valid area from the value I see in your screenshot. I assume you have no valid vector table at address 0x0000'0000, so you need to make sure that the SP points to a valid address.
Not sure if you are following my blog, but I should have you covered here:
I hope this helps?
Erich
First of all, please let us know what MCU are you using. I think there's no general explanation/suggestion for your request.
Depending on boot mode & boot source, there might be some assumptions with regards to where the app's entry point is fetched from. In your case, the bootrom reads the vector table from 0x0 and then extracts the entry point (ResetISR) from there. But given that there's nothing written in flash at that address, 0xFFFF_FFFE (0xFFFF_FFFF actually being read) is used as an entry point.
I'm also not sure that forcing PC to a specific value is correct, given that the debugger stops the target "somewhere" in bootrom code to be able to do other things. If PC is forced to some other value than the one the bootrom wants to use, there will be bootrom code that won't be executed once target is resumed.
From a high level perspective, I think you'll need to make sure that "soft reset" is used once the app is programmed in flash at the given address, forcing the debug stub/server to use the entry point found in the app. This is somehow similar to a RAM debug session. So don't leave the bootrom the opportunity to set the entry point after system reset but allow the debugger to set the entry point (read from the app) after flash is being performed and soft reset is issued.
Regards,
MCUXpresso IDE Support
You would have to tell the debugger where the symbols are (or load them independently) of the 'other' part of the application, see https://mcuoneclipse.com/2020/11/03/debugging-bootloader-and-application-with-one-debug-session/
As for the application setup, I'm using FreeMarker scripts (see https://mcuoneclipse.com/2019/10/06/linking-bootloader-applications-with-eclipse-and-freemarker-scri...) to adjust the memory mapping.
As for the initial PC during debug: this depends on some extend on the debug probe used. For example the probe might read the initial PC from the binary or from the reset vector. But this does not help if the probe does a hardware reset command at the beginning: then the hardware will fetch the PC from the memory/vector table.
I hope this helps,
Erich
Hi Erich, thank you for your reply, URL links and years of a helpful blog.
Your URLs in your reply are interesting; I may have to do it in one of those ways. But see my old post here:
https://stackoverflow.com/questions/56602524/how-does-arm-find-my-relocated-vector-table
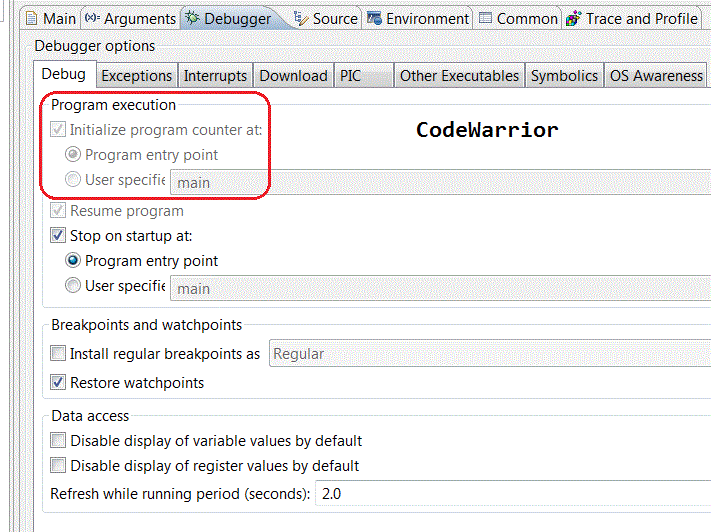
Back then, I successfully debugged an application with a relocated vector table in CodeWarrior v10 without a bootloader or extra symbol loading. It seems this grayed-out setting is involved:
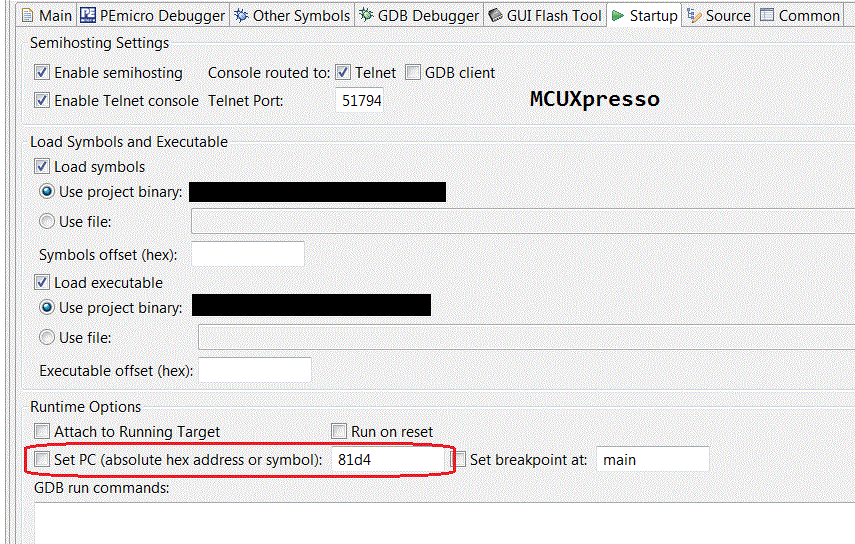
I assume the debugger gets the "Program entry point" from the ENTRY() setting in the linker descriptor file (*.ld) and then sets the Program Counter. I suspect this same feature in MCUXpresso v11 (which I have to manually type in myself) doesn't work:
I'm looking for confirmation.
In other words, load any example project and set its MCU Settings (if using a K64) so that PROGRAM_FLASH is set to 0x8000 with length = 0xF0000. Can it be debugged like it can in CodeWarrior 10? Why not?
Maybe I still don't get your point, so I try to explain what happens:
- the debugger (gdb in this case) connects to the target and for example programs the flash
- the debugger show the initial source file and PC based on the ENTRY symbol set by the linker in the binary.
- then what happens depends on how you have configured the launch configuration: usually gdb will set a breakpoint on main symbol, the performs a reset with the probe and the target does whatever it has to do on reset (means fetching the initial PC and SP from the vector table)
Now if you want to set the initial PC 'manually', then you have to disable the 'reset' part.
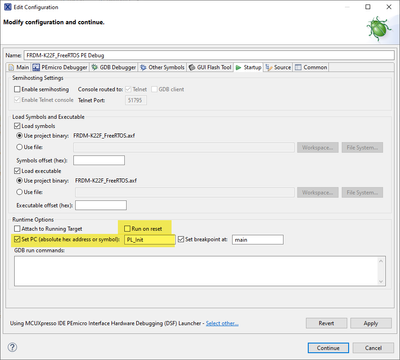
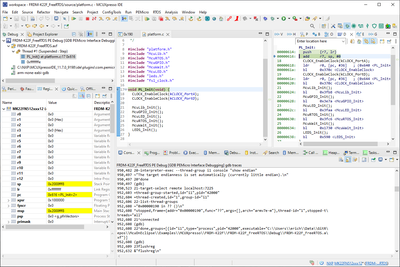
I see from your screenshot that you are using a PEMICRO probe, so I just verified that on my side, using the IDE 11.7.0: Disabled the 'run on reset' and set the initial PC to the PL_Init function/symbol:
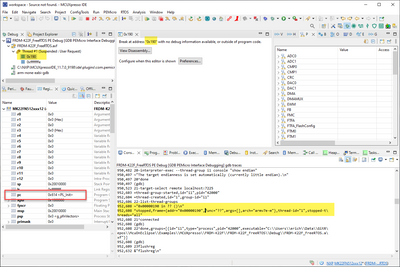
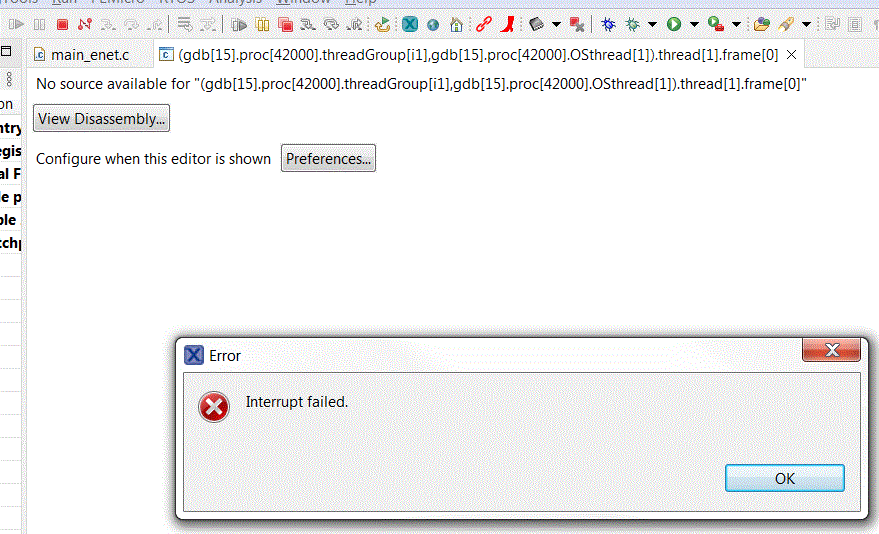
Now if I launch it, I get this:
That looks not exactly what I would expect. The source file is shown for 0x190. This looks like something in the GDB (see gdb traces) where gdb tries to get a list of threads (which do not exist at this stage), so possibly a glitch.
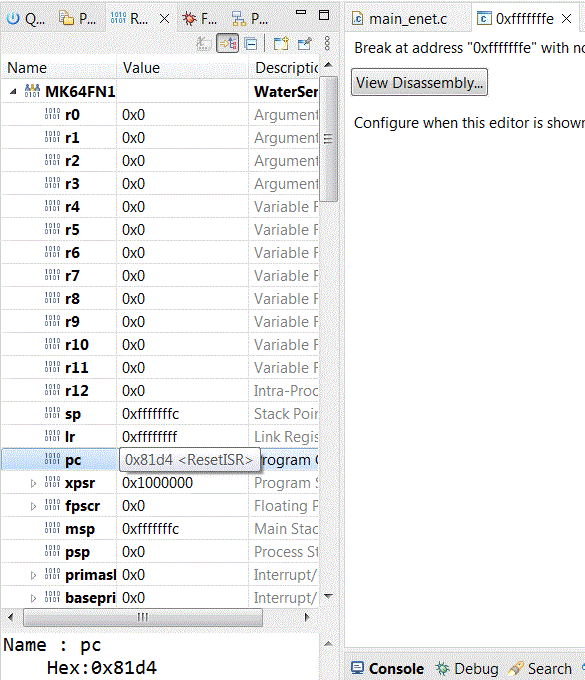
But as you can see in the Registers view, the PC is correctly configured and set.
And indeed, if I do an assembly step, it shows me that the PC was set where I wanted to have it:
I hope this helps,
Erich
Ah, interesting. Even though I don't have the "Set breakpoint at:" box checked, the debugger stops immediately(?); but I do see my PC has been set to the correct "ResetISR"/address.
My debugger doesn't work after this step, no matter what I do. Is that because the Stack Pointer (SP) (or others) are not set properly? If so, are they supposed to be set via the debugger (pod) or via the executing code?
Yes, your SP is not pointing to a valid area from the value I see in your screenshot. I assume you have no valid vector table at address 0x0000'0000, so you need to make sure that the SP points to a valid address.
Not sure if you are following my blog, but I should have you covered here:
I hope this helps?
Erich
Thank you very much for your reply and specific blog post...I feel honored.
extern unsigned long _vStackBase; // From linker configuration files.
__asm(
"LDR R0, = _vStackBase \n"
"MSR MSP, R0 \n"
"MSR PSP, R0 \n"
);
So shame on me for not remembering what I had done years ago, and thanks to you for helping me resolve this! Bonus: This solution is not a hard-coded one like the .mac files, so one can "set it and forget it".
Is the quirk you mentioned in the IDE a bug that needs to be reported?
Update: And I also added code to ResetISR() to point the register at the relocated vector table (at 0x8000):
unsigned int * pSCB_VTOR = (unsigned int *) 0xE000ED08;
// Set the interrupt vector table position.
*pSCB_VTOR = (unsigned int)(0x8000);

