- Forums
- Product Forums
- General Purpose MicrocontrollersGeneral Purpose Microcontrollers
- i.MX Forumsi.MX Forums
- QorIQ Processing PlatformsQorIQ Processing Platforms
- Identification and SecurityIdentification and Security
- Power ManagementPower Management
- Wireless ConnectivityWireless Connectivity
- RFID / NFCRFID / NFC
- Advanced AnalogAdvanced Analog
- MCX Microcontrollers
- S32G
- S32K
- S32V
- MPC5xxx
- Other NXP Products
- S12 / MagniV Microcontrollers
- Powertrain and Electrification Analog Drivers
- Sensors
- Vybrid Processors
- Digital Signal Controllers
- 8-bit Microcontrollers
- ColdFire/68K Microcontrollers and Processors
- PowerQUICC Processors
- OSBDM and TBDML
- S32M
- S32Z/E
-
- Solution Forums
- Software Forums
- MCUXpresso Software and ToolsMCUXpresso Software and Tools
- CodeWarriorCodeWarrior
- MQX Software SolutionsMQX Software Solutions
- Model-Based Design Toolbox (MBDT)Model-Based Design Toolbox (MBDT)
- FreeMASTER
- eIQ Machine Learning Software
- Embedded Software and Tools Clinic
- S32 SDK
- S32 Design Studio
- GUI Guider
- Zephyr Project
- Voice Technology
- Application Software Packs
- Secure Provisioning SDK (SPSDK)
- Processor Expert Software
- Generative AI & LLMs
-
- Topics
- Mobile Robotics - Drones and RoversMobile Robotics - Drones and Rovers
- NXP Training ContentNXP Training Content
- University ProgramsUniversity Programs
- Rapid IoT
- NXP Designs
- SafeAssure-Community
- OSS Security & Maintenance
- Using Our Community
-
- Cloud Lab Forums
-
- Knowledge Bases
- ARM Microcontrollers
- i.MX Processors
- Identification and Security
- Model-Based Design Toolbox (MBDT)
- QorIQ Processing Platforms
- S32 Automotive Processing Platform
- Wireless Connectivity
- CodeWarrior
- MCUXpresso Suite of Software and Tools
- MQX Software Solutions
- RFID / NFC
- Advanced Analog
-
- NXP Tech Blogs
- Home
- :
- CodeWarrior
- :
- CodeWarrior for QorIQ
- :
- Re: Unable to use Codewarrior debugging for BL2 (button grayed out)
Unable to use Codewarrior debugging for BL2 (button grayed out)
- Subscribe to RSS Feed
- Mark Topic as New
- Mark Topic as Read
- Float this Topic for Current User
- Bookmark
- Subscribe
- Mute
- Printer Friendly Page
- Mark as New
- Bookmark
- Subscribe
- Mute
- Subscribe to RSS Feed
- Permalink
- Report Inappropriate Content
Hello,
I am using an LS1046ardb board, and I'm attempting to use Codewarrior to debug my BL2 image. I'm booting from qspi flash, and I would like to attach to the running program.
I've been following this guide for U-Boot: https://community.nxp.com/t5/CodeWarrior-for-QorIQ-Knowledge/Use-CodeWarrior-for-ARMv8-to-Debug-U-bo...
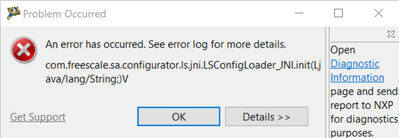
The issue is when I setup the debug configuration profile I get an error message and the "debug" button is grayed out:
As you can see, I'm trying to use the "GDB hardware debugging" configuration with my bl2.elf symbol image, but cannot select the debug button.
My TAP works correctly, I am able to inspect the running system and read/write the flash, so I don't understand why this doesn't work.
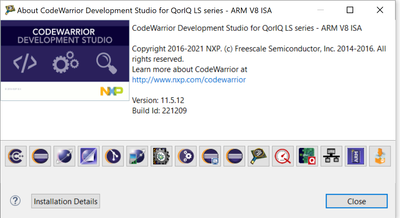
Please find my codewarrior version below:
Thank you for your help!
Solved! Go to Solution.
- Mark as New
- Bookmark
- Subscribe
- Mute
- Subscribe to RSS Feed
- Permalink
- Report Inappropriate Content
I have found the solution. The problem is I had the target connection activated under the "Target connections" tab. The solution was to go to the "Target Connections" tab, then select the active connection, then press "Deactivate", then import the bl2.elf using the steps provided by @yipingwang. The target connection will be specified in the debug configuration under the "Debugger" tab, and will automatically connect when the debug configuration is run. So there is no need to use the "Target Connections" window and there should be no active connection.
- Mark as New
- Bookmark
- Subscribe
- Mute
- Subscribe to RSS Feed
- Permalink
- Report Inappropriate Content
@yipingwang
Thank you for the document. Unfortunately I am facing the same error and the button is still greyed out:
- Mark as New
- Bookmark
- Subscribe
- Mute
- Subscribe to RSS Feed
- Permalink
- Report Inappropriate Content
Please open CodeWarrior IDE in a new workspace, then import bl2.elf to create a bare board project. Then click Run->Debug Configurations, the debug button should be active.
If your problem persists, please try to install CodeWarrior for ARMv8 on another PC to do verification.
- Mark as New
- Bookmark
- Subscribe
- Mute
- Subscribe to RSS Feed
- Permalink
- Report Inappropriate Content
For atf debugging, please refer to my latest step by step document.
- Mark as New
- Bookmark
- Subscribe
- Mute
- Subscribe to RSS Feed
- Permalink
- Report Inappropriate Content
Thank you for the document. Unfortunately I am facing the same error message and the button is still greyed out


