- Forums
- Product Forums
- General Purpose MicrocontrollersGeneral Purpose Microcontrollers
- i.MX Forumsi.MX Forums
- QorIQ Processing PlatformsQorIQ Processing Platforms
- Identification and SecurityIdentification and Security
- Power ManagementPower Management
- Wireless ConnectivityWireless Connectivity
- RFID / NFCRFID / NFC
- Advanced AnalogAdvanced Analog
- MCX Microcontrollers
- S32G
- S32K
- S32V
- MPC5xxx
- Other NXP Products
- S12 / MagniV Microcontrollers
- Powertrain and Electrification Analog Drivers
- Sensors
- Vybrid Processors
- Digital Signal Controllers
- 8-bit Microcontrollers
- ColdFire/68K Microcontrollers and Processors
- PowerQUICC Processors
- OSBDM and TBDML
- S32M
- S32Z/E
-
- Solution Forums
- Software Forums
- MCUXpresso Software and ToolsMCUXpresso Software and Tools
- CodeWarriorCodeWarrior
- MQX Software SolutionsMQX Software Solutions
- Model-Based Design Toolbox (MBDT)Model-Based Design Toolbox (MBDT)
- FreeMASTER
- eIQ Machine Learning Software
- Embedded Software and Tools Clinic
- S32 SDK
- S32 Design Studio
- GUI Guider
- Zephyr Project
- Voice Technology
- Application Software Packs
- Secure Provisioning SDK (SPSDK)
- Processor Expert Software
- Generative AI & LLMs
-
- Topics
- Mobile Robotics - Drones and RoversMobile Robotics - Drones and Rovers
- NXP Training ContentNXP Training Content
- University ProgramsUniversity Programs
- Rapid IoT
- NXP Designs
- SafeAssure-Community
- OSS Security & Maintenance
- Using Our Community
-
- Cloud Lab Forums
-
- Knowledge Bases
- ARM Microcontrollers
- i.MX Processors
- Identification and Security
- Model-Based Design Toolbox (MBDT)
- QorIQ Processing Platforms
- S32 Automotive Processing Platform
- Wireless Connectivity
- CodeWarrior
- MCUXpresso Suite of Software and Tools
- MQX Software Solutions
- RFID / NFC
- Advanced Analog
-
- NXP Tech Blogs
- Home
- :
- CodeWarrior
- :
- CodeWarrior for MCU
- :
- Re: CW10.x freezes on debugger-launch
CW10.x freezes on debugger-launch
I've been using CW10.5 for three weeks, and have used it on both 9S08 and MCFMM256 projects. Everything went well until yesterday, when the 'debugger-launch' froze with no explanation.
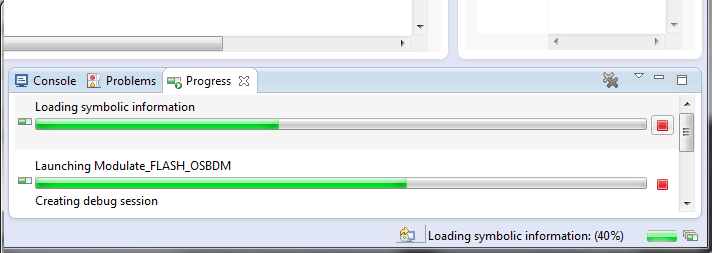
Looking at the 'progress' tab shows this:
Unless one looks at the 'progress'-tab, it's not obvious what;s going on, and any number of launches can be attempted, each one leaving a 'Loading symbolic information' operation that can only be deleted by closing CW.
That "40%" occasionally gets as high as 60%, but never finishes. And clicking the red button does not affect the results, except to note that 'Cancel Requested.' No cancellation occurs
- Working with TWR-MCF51MM demo-board, using on-board OSBDM
- Windows 7, 64-bit
- Re-installed 10.5 with no change
- Installed 10.6 ditto
Does anyone have an idea on this?
Wade Hassler
已解决! 转到解答。
That's definitely not normal. Can you check if you Zombie tasks running, see http://mcuoneclipse.com/2012/06/01/killing-me-softly-zombies-and-debugger-engines/
How much RAM does your Windows system have?
... and now it doesn't. "All I did was®" add a table of 12-bit values for sin(x) to the source and the problem vanished. It works as before and I can't make it fail (not that I tried too hard.)
I couldn't really call this one 'answered,' but I am done with it.
Wade Hassler
Maybe talkin' to myself, but...
The problem appears to be slow-motion response from the debugger. The 'eternal symbol load' described above will complete, but takes at least fifteen minutes.
More: clicking the 'pause execution' button takes about a minute to happen (this was always the case.).
After a pause, the 'CPU Registers' window, as an example, is populated at about one value every five seconds: this used to be nearly instant.
Editing, re-compiling and reflashing the device has a turnaround time of minimum twenty minutes:
Wade Hassler
That's definitely not normal. Can you check if you Zombie tasks running, see http://mcuoneclipse.com/2012/06/01/killing-me-softly-zombies-and-debugger-engines/
How much RAM does your Windows system have?
Thanks for the response.
Your explanation of zombie-processes makes sense, and I had already checked Task Manager several times looking for suspects: at one time there were two running copies of DE.exe, but only once, of a dozen or so instances.
It still sits at "Loading symbolic information: 40%" for a reliable 20 minutes. What exactly is going on in that operation?
I have 8GB of memory and have turned off all the big consumers ( big apps, multiple .pdf's etc.)
Wade Hassler

