- Forums
- Product Forums
- General Purpose MicrocontrollersGeneral Purpose Microcontrollers
- i.MX Forumsi.MX Forums
- QorIQ Processing PlatformsQorIQ Processing Platforms
- Identification and SecurityIdentification and Security
- Power ManagementPower Management
- Wireless ConnectivityWireless Connectivity
- RFID / NFCRFID / NFC
- Advanced AnalogAdvanced Analog
- MCX Microcontrollers
- S32G
- S32K
- S32V
- MPC5xxx
- Other NXP Products
- S12 / MagniV Microcontrollers
- Powertrain and Electrification Analog Drivers
- Sensors
- Vybrid Processors
- Digital Signal Controllers
- 8-bit Microcontrollers
- ColdFire/68K Microcontrollers and Processors
- PowerQUICC Processors
- OSBDM and TBDML
- S32M
- S32Z/E
-
- Solution Forums
- Software Forums
- MCUXpresso Software and ToolsMCUXpresso Software and Tools
- CodeWarriorCodeWarrior
- MQX Software SolutionsMQX Software Solutions
- Model-Based Design Toolbox (MBDT)Model-Based Design Toolbox (MBDT)
- FreeMASTER
- eIQ Machine Learning Software
- Embedded Software and Tools Clinic
- S32 SDK
- S32 Design Studio
- GUI Guider
- Zephyr Project
- Voice Technology
- Application Software Packs
- Secure Provisioning SDK (SPSDK)
- Processor Expert Software
- Generative AI & LLMs
-
- Topics
- Mobile Robotics - Drones and RoversMobile Robotics - Drones and Rovers
- NXP Training ContentNXP Training Content
- University ProgramsUniversity Programs
- Rapid IoT
- NXP Designs
- SafeAssure-Community
- OSS Security & Maintenance
- Using Our Community
-
- Cloud Lab Forums
-
- Knowledge Bases
- ARM Microcontrollers
- i.MX Processors
- Identification and Security
- Model-Based Design Toolbox (MBDT)
- QorIQ Processing Platforms
- S32 Automotive Processing Platform
- Wireless Connectivity
- CodeWarrior
- MCUXpresso Suite of Software and Tools
- MQX Software Solutions
- RFID / NFC
- Advanced Analog
-
- NXP Tech Blogs
- Home
- :
- MCUXpresso Software and Tools
- :
- LPCXpresso IDE FAQs
- :
- How to use ITM Printf
How to use ITM Printf
- Subscribe to RSS Feed
- Mark Topic as New
- Mark Topic as Read
- Float this Topic for Current User
- Bookmark
- Subscribe
- Mute
- Printer Friendly Page
How to use ITM Printf
- Mark as New
- Bookmark
- Subscribe
- Mute
- Subscribe to RSS Feed
- Permalink
- Report Inappropriate Content
Updated: Now also compatible with the newlib nohost library.
ITM Overview
As part of its SWO Trace functionality, LPCXpresso IDE v8.0.0 introduced the ability to make use of the ITM : The Instrumentation Trace Macrocell (ITM) block provides a mechanism for sending data from your target to the debugger via the SWO trade stream. This communication is achieved though a memory-mapped register interface. Data written to any of 32 stimulus registers is forwarded to the SWO stream. Unlike other SWO functionality, using the ITM stimulus ports requires changes to your code and so should not be considered non-intrusive.
Using the ITM to handle printf and scanf
Note LPCXpresso IDE v8.0.0 only supports ITM via stimulus port 0.
Scanf functionality is achieved via a special global variable, which allows the debugger to send characters from the console to the target (using the trace interface). The debugger writes data to the global variable named ITM_RxBuffer to be picked up by scanf.
To use this functionality with an LPC Open project you need to:
Include the attached file (retarget_itm.c) in your project.
Ensure you are using the redlib semihost or redlib or newlib nohost library.
Then simply add calls to printf and scanf to your code.
If you just linking against the LPCOpen Chip library, then this is all you need to do. However if you are also linking against an LPCOpen board library then you will likely see build errors of the form:
../src/retarget.h:224: multiple definition of `__sys_write'
../src/retarget.h:240: multiple definition of `__sys_readc'
- locating the file board.h and enable the line: #define DEBUG_SEMIHOSTING, or
- locating the source file board.c within the LPCOpen board library and comment out the line: #include "retarget.h
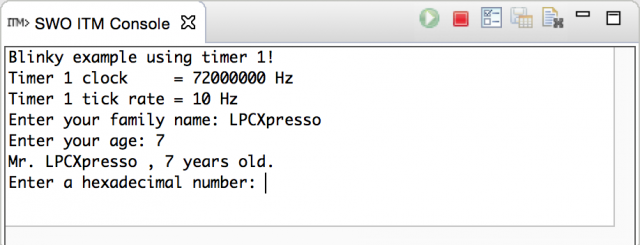
SWO ITM console view
Data written to the ITM stimulus port 0 is presented in this view (as below) . The view shows the ITM console for the active debug session. Text entered into this console is sent to the target if a suitable receiving buffer exists (specifically the global int32_t ITM_RxBuffer).
Note that once the target is terminated the view is cleared.
Within this view, there are the standard start and stop buttons.
When ITM trace is started, and data sent from the target will be displayed in this view.
When ITM trace is stopped, any data sent from the target will not be captured.
Note choosing to display ITM trace data has no impact on the performance of code running on the target MCU.
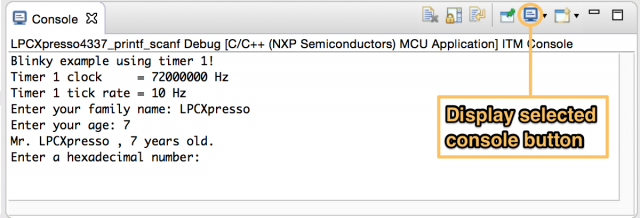
In addition to the standalone ITM Console view, the ITM console is also displayed as part of the standard console viewer . It can be displayed by selecting the “Display Selected Console” button and choosing the console named "<your project> ITM Console". This view persists after the target is terminated, unlike the standalone ITM console view.
Note the standard console viewer switches automatically between consoles to show consoles that are being written to. This switching can be confusing as the ITM console is easily lost among the other consoles displayed there. It is easier to keep track of the standalone ITM console.
ITM vs Semihosting
ITM printf and semihosting printf may seem to offer similar features however there are significant differences between these two schemes.
- A semihosted event halts the MCU and needs support from the debug tools to handle the semihosted operation.
- Without debug tools attached, a semihosted event will permanently halt the MCU.
- Semihosting events will not be lost, since the MCU will be halted until the event is processed.
- Semihosting is supported on all LPC MCUs.
- An ITM event sends data to a port and does not cause the MCU to halt.
- Without debug tools attached, an ITM event will not halt the MCU, it will simply be ignored.
- ITM operations could be left within production code, thereby allowing logging information to be captured simply by connecting debug tools to a running MCU.
- ITM is only available on LPC MCUs using Cortex-M3 and Cortex-M4 cores.
- Within the LPCXpresso IDE version 8.0, ITM operations only support printf and scanf functionality.
For further information please see the following FAQs:
Overview of Trace support in LPCXpresso IDE
Switching the selected C library
Original Attachment has been moved to: retarget_itm.c.zip
- Mark as New
- Bookmark
- Subscribe
- Mute
- Subscribe to RSS Feed
- Permalink
- Report Inappropriate Content
I confirm, the link to source is broken ...
- Mark as New
- Bookmark
- Subscribe
- Mute
- Subscribe to RSS Feed
- Permalink
- Report Inappropriate Content
ITM is also available on Cortex M33, M7, and... right?
Would be great if you could update the list above.
Also, link to source is broken...
Thanks!


