- Forums
- Product Forums
- General Purpose MicrocontrollersGeneral Purpose Microcontrollers
- i.MX Forumsi.MX Forums
- QorIQ Processing PlatformsQorIQ Processing Platforms
- Identification and SecurityIdentification and Security
- Power ManagementPower Management
- Wireless ConnectivityWireless Connectivity
- RFID / NFCRFID / NFC
- Advanced AnalogAdvanced Analog
- MCX Microcontrollers
- S32G
- S32K
- S32V
- MPC5xxx
- Other NXP Products
- S12 / MagniV Microcontrollers
- Powertrain and Electrification Analog Drivers
- Sensors
- Vybrid Processors
- Digital Signal Controllers
- 8-bit Microcontrollers
- ColdFire/68K Microcontrollers and Processors
- PowerQUICC Processors
- OSBDM and TBDML
- S32M
- S32Z/E
-
- Solution Forums
- Software Forums
- MCUXpresso Software and ToolsMCUXpresso Software and Tools
- CodeWarriorCodeWarrior
- MQX Software SolutionsMQX Software Solutions
- Model-Based Design Toolbox (MBDT)Model-Based Design Toolbox (MBDT)
- FreeMASTER
- eIQ Machine Learning Software
- Embedded Software and Tools Clinic
- S32 SDK
- S32 Design Studio
- GUI Guider
- Zephyr Project
- Voice Technology
- Application Software Packs
- Secure Provisioning SDK (SPSDK)
- Processor Expert Software
- Generative AI & LLMs
-
- Topics
- Mobile Robotics - Drones and RoversMobile Robotics - Drones and Rovers
- NXP Training ContentNXP Training Content
- University ProgramsUniversity Programs
- Rapid IoT
- NXP Designs
- SafeAssure-Community
- OSS Security & Maintenance
- Using Our Community
-
- Cloud Lab Forums
-
- Knowledge Bases
- ARM Microcontrollers
- i.MX Processors
- Identification and Security
- Model-Based Design Toolbox (MBDT)
- QorIQ Processing Platforms
- S32 Automotive Processing Platform
- Wireless Connectivity
- CodeWarrior
- MCUXpresso Suite of Software and Tools
- MQX Software Solutions
- RFID / NFC
- Advanced Analog
-
- NXP Tech Blogs
- Home
- :
- i.MX Forums
- :
- i.MX RT Crossover MCUs
- :
- FreeRTOS Task Debugging - Same Backtrace for all Threads
FreeRTOS Task Debugging - Same Backtrace for all Threads
- Subscribe to RSS Feed
- Mark Topic as New
- Mark Topic as Read
- Float this Topic for Current User
- Bookmark
- Subscribe
- Mute
- Printer Friendly Page
FreeRTOS Task Debugging - Same Backtrace for all Threads
- Mark as New
- Bookmark
- Subscribe
- Mute
- Subscribe to RSS Feed
- Permalink
- Report Inappropriate Content
Hi,
I'm debugging a FreeRTOS sample project on i.MX1024EVK using MCUXpresso version 11.7.1. Using JLink SWD, the 'Select RTOS plugin' is set to 'GDBServer/RTOSPlugin_FreeRTOS'. Optimization is set to none (-O0). When debugger is stopped, the 'Debug' view in MCUXpresso is populated with the correct number of tasks, but they all have the same backtrace. This seems like it would be a frequently reported issue, since I have a fairly default setup, using the EVK with a sample project, but I can't find a similar reported issue anywhere. The GDB command line in 'Debugger Console' reports the same results. This issue is observed with multiple sample and custom projects.
Any help appreciated.
lemk
- Mark as New
- Bookmark
- Subscribe
- Mute
- Subscribe to RSS Feed
- Permalink
- Report Inappropriate Content
Hi Edwin,
Thanks for your reply. I'm using JLink, not LinkServer. The all-stop/non-stop option is not available from what I can tell. Per the 'IDE FreeRTOS Debug Guide', the only configuration I've changed in the 'JLink Debugger' configuration is selecting 'GDBServer/RTOSPlugin_FreeRTOS' for 'Select RTOS Plugin'
Thanks,
lemk
- Mark as New
- Bookmark
- Subscribe
- Mute
- Subscribe to RSS Feed
- Permalink
- Report Inappropriate Content
Hi @lemk34,
I'm not able to reproduce this issue. As you can see on the following screenshot, I am able to see the proper backtrace for each one of the tasks from the hello_world_freertos example:
It is worth noting that I am using an RT1020EVK with the onboard debugger, but this goes to show that there is no limitation about the backtraces not displaying properly. I am also using MCUXpresso IDE version 11.9.0. Please try with the newest version of the IDE, as bugfixes and improvements are constantly being applied to newer versions of our IDE.
BR,
Edwin.
- Mark as New
- Bookmark
- Subscribe
- Mute
- Subscribe to RSS Feed
- Permalink
- Report Inappropriate Content
Hi Edwin,
Because of your last email, I switched to the onboard debugger and was able to view each task's backtrace successfully. Unfortunately that isn't an option for our custom board. But I shifted focus to the JLink RTOS plugin, and upgraded the JLink software and am now successful. A couple of recent comments in the release notes might have resolved the issue (RTOSPlugin for FreeRTOS did not report correct task registers. Fixed.). ¯\_(ツ)_/¯
Thanks for your responses.
lemk
- Mark as New
- Bookmark
- Subscribe
- Mute
- Subscribe to RSS Feed
- Permalink
- Report Inappropriate Content
Hi again @lemk34,
I'm glad to hear that you were able to solve this problem! Interesting that the issue was present because of the JLink drivers. Anyhow, thanks for reporting this, as I am sure it can prove useful for other clients in the future that might get similar issues with the backtrace on Jlink RTOS Plugin.
Have a nice day. c:
Edwin.
- Mark as New
- Bookmark
- Subscribe
- Mute
- Subscribe to RSS Feed
- Permalink
- Report Inappropriate Content
Hi @lemk34,
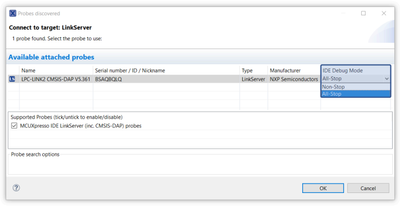
Quick question. Are you certain you are debugging on All-Stop mode (rather than the default Non-Stop mode)?
This is one of the steps needed to do thread-aware debugging for FreeRTOS applications, for example. I got this from the MCUXpresso IDE FreeRTOS Debug Guide, which if you haven't read, I highly recommend you do so. You can find this guide on your MCUXpresso IDE installation path, by default it should look like this: <C:\nxp\MCUXpressoIDE_11.9.0_2144>.
BR,
Edwin.


