
- Forums
- Product Forums
- General Purpose MicrocontrollersGeneral Purpose Microcontrollers
- i.MX Forumsi.MX Forums
- QorIQ Processing PlatformsQorIQ Processing Platforms
- Identification and SecurityIdentification and Security
- Power ManagementPower Management
- Wireless ConnectivityWireless Connectivity
- RFID / NFCRFID / NFC
- Advanced AnalogAdvanced Analog
- Neural Processing UnitsNeural Processing Units
- MCX Microcontrollers
- S32G
- S32K
- S32V
- MPC5xxx
- Other NXP Products
- S12 / MagniV Microcontrollers
- Powertrain and Electrification Analog Drivers
- Sensors
- Vybrid Processors
- Digital Signal Controllers
- 8-bit Microcontrollers
- ColdFire/68K Microcontrollers and Processors
- PowerQUICC Processors
- OSBDM and TBDML
- S32M
- S32Z/E
-
- Solution Forums
- Software Forums
- MCUXpresso Software and ToolsMCUXpresso Software and Tools
- CodeWarriorCodeWarrior
- MQX Software SolutionsMQX Software Solutions
- Model-Based Design Toolbox (MBDT)Model-Based Design Toolbox (MBDT)
- FreeMASTER
- eIQ Machine Learning Software
- Embedded Software and Tools Clinic
- S32 SDK
- S32 Design Studio
- GUI Guider
- Zephyr Project
- Voice Technology
- Application Software Packs
- Secure Provisioning SDK (SPSDK)
- Processor Expert Software
- Generative AI & LLMs
-
- Topics
- Mobile Robotics - Drones and RoversMobile Robotics - Drones and Rovers
- NXP Training ContentNXP Training Content
- University ProgramsUniversity Programs
- Rapid IoT
- NXP Designs
- SafeAssure-Community
- OSS Security & Maintenance
- Using Our Community
-
- Cloud Lab Forums
-
- Knowledge Bases
- ARM Microcontrollers
- i.MX Processors
- Identification and Security
- Model-Based Design Toolbox (MBDT)
- QorIQ Processing Platforms
- S32 Automotive Processing Platform
- Wireless Connectivity
- CodeWarrior
- MCUXpresso Suite of Software and Tools
- MQX Software Solutions
- RFID / NFC
- Advanced Analog
- Neural Processing Units
-
- NXP Tech Blogs
- Home
- :
- i.MX Forums
- :
- i.MX Processors
- :
- Re: RT1061 debugging issue (JLink)
RT1061 debugging issue (JLink)
- Subscribe to RSS Feed
- Mark Topic as New
- Mark Topic as Read
- Float this Topic for Current User
- Bookmark
- Subscribe
- Mute
- Printer Friendly Page
RT1061 debugging issue (JLink)
- Mark as New
- Bookmark
- Subscribe
- Mute
- Subscribe to RSS Feed
- Permalink
- Report Inappropriate Content
Hello,
We are developing an application for NXP RT1061 (custom board) and are experiencing some issues when it comes to debugging.
MCU: MIMXRT1061CVL5B
Flash: IS25LP032D
Debuger: JLink Plus
1. The JLink server seems to have problems halting the mcu after reset, when running and debugging from flash, hinting that we have faulty flash settings. (Flash configuration is appended at the end.)
This causes for example breakpoints in the beginning of main not to trigger. And possibly also other issues as described below.
Log from JLinkServer:
Received monitor command: reset
ResetTarget() start
Core did not halt on flash image verification. Assuming faulty flash settings.
Halting target manually.
ResetTarget() end
What causes this, do we have the wrong flash configuration?
2. We have no problem booting from the flash. However once a program is present in the flash the Jlink Debugger is unable to reprogram the flash. Could be related to issue 1 since if we insert a delay in the beginning of main it works. We have some units which we at the moment are unable to recover because of this.
We suspect that configuring the MPU or something similar to this prevent JLink from uploading its "Ram code" but we have not been able to confirm this. We have however tried to disable the MPU using JLink commander but have not been successful. The FlexRam module has default configuration (128k DTC, 128K ITC, 256K OC).
JLink Commander Log:
J-Link>exec EnableEraseAllFlashBanks
J-Link>erase
Without any given address range, Erase Chip will be executed
Erasing device...
****** Error: Failed to prepare RAMCode using RAM
Error while determining flash info (Bank @ 0x60000000)
ERROR: Erase returned with error code -1.
3. Starting a debug session takes a long time.
The time from when the program has been written to flash/ram and the triggering of the first breakpoint in main is long sometimes more than a minute. This could for some reason be a related to the application size since we do not experience this issue when running nxp's example applications. Our application is around 400k. This happens both if we execute from ram and flash.
We are using McuXpresso.
What could be causing this? Anything we can do to improve the debugging experience.
Thanks
/Björn
Flash config:
const flexspi_nor_config_t qspiflash_config = {
.memConfig =
{
.tag = FLEXSPI_CFG_BLK_TAG,
.version = FLEXSPI_CFG_BLK_VERSION,
.readSampleClksrc=kFlexSPIReadSampleClk_LoopbackFromDqsPad,
.csHoldTime = 3u,
.csSetupTime = 3u,
.sflashPadType = kSerialFlash_4Pads,
.serialClkFreq = kFlexSpiSerialClk_100MHz,
.sflashA1Size = 4u * 1024u * 1024u,
.lookupTable =
{
// 0 Read LUTs
FLEXSPI_LUT_SEQ(CMD_SDR, FLEXSPI_1PAD, 0xEB, RADDR_SDR, FLEXSPI_4PAD, 0x18),
FLEXSPI_LUT_SEQ(DUMMY_SDR, FLEXSPI_4PAD, 0x06, READ_SDR, FLEXSPI_4PAD, 0x04),
0,0,
// 1 Read Status
FLEXSPI_LUT_SEQ(CMD_SDR, FLEXSPI_1PAD, 0x81, READ_SDR, FLEXSPI_1PAD, 0x04),
0,0,0,
// 2 Reserved
0,0,0,0,
// 3 Write Enable
FLEXSPI_LUT_SEQ(CMD_SDR, FLEXSPI_1PAD, 0x06, STOP, FLEXSPI_1PAD, 0),
0,0,0,
// 4 Reserved
0,0,0,0,
// 5 Erase Sector
FLEXSPI_LUT_SEQ(CMD_SDR, FLEXSPI_1PAD, 0xD7, RADDR_SDR, FLEXSPI_1PAD, 0x18),
0,0,0,
// 6 Reserved
0,0,0,0,
// 7 Reserved
0,0,0,0,
// 8 Reserved
0,0,0,0,
// 9 Page Program
FLEXSPI_LUT_SEQ(CMD_SDR, FLEXSPI_1PAD, 0x32, RADDR_SDR, FLEXSPI_1PAD, 0x18),
FLEXSPI_LUT_SEQ(WRITE_SDR, FLEXSPI_4PAD, 0x04, STOP, FLEXSPI_1PAD, 0),
0,0,
// 10 Reserved
0,0,0,0,
// 11 Chip Erase
FLEXSPI_LUT_SEQ(CMD_SDR, FLEXSPI_1PAD, 0xC7, STOP, FLEXSPI_1PAD, 0),
0,0,0,
// 12 Reserved
0,0,0,0,
},
},
.pageSize = 256u,
.sectorSize = 4u * 1024u,
.blockSize = 64u * 1024u,
.isUniformBlockSize = false,
};
- Mark as New
- Bookmark
- Subscribe
- Mute
- Subscribe to RSS Feed
- Permalink
- Report Inappropriate Content
Hi,
Thank you for your interest in NXP Semiconductor products and for the opportunity to serve you.
Firstly, I'd like to know the ratio of the phenomenon that arises, second, I'd highly recommend you to use the tool to verify the FlexSPI connection, meanwhile, you'd better check the hardware board, especially, the power supply circuit.
Have a great day,
TIC
-------------------------------------------------------------------------------
Note:
- If this post answers your question, please click the "Mark Correct" button. Thank you!
- We are following threads for 7 weeks after the last post, later replies are ignored
Please open a new thread and refer to the closed one, if you have a related question at a later point in time.
-------------------------------------------------------------------------------
- Mark as New
- Bookmark
- Subscribe
- Mute
- Subscribe to RSS Feed
- Permalink
- Report Inappropriate Content
Thanks for the answer.
What tool are you referring to?
The problems we are having is constant. It does not seem to change between runs.
I will as our hardware designer to dubble check the flash power supply circuit.
Thanks
/Björn
- Mark as New
- Bookmark
- Subscribe
- Mute
- Subscribe to RSS Feed
- Permalink
- Report Inappropriate Content
Hi,
Thanks for your reply.
The tool is the NXP-MCUBootUtility, and I was wondering if you can update the schematic of the custom board.
Have a great day,
TIC
-------------------------------------------------------------------------------
Note:
- If this post answers your question, please click the "Mark Correct" button. Thank you!
- We are following threads for 7 weeks after the last post, later replies are ignored
Please open a new thread and refer to the closed one, if you have a related question at a later point in time.
-------------------------------------------------------------------------------
- Mark as New
- Bookmark
- Subscribe
- Mute
- Subscribe to RSS Feed
- Permalink
- Report Inappropriate Content
Hello,
Thanks for your reply.
Is there any way to send you the schematics privately?
When it comes to point 3 above, I have tried to debug using SEGGERS Ozone tool and it seems to be lightning fast with the same binary. It seems that mcuxpresso has some issue handling large projects or I have some configuration somewhere that is wrong. Is this a knonw issue?
Thanks
/Björn
- Mark as New
- Bookmark
- Subscribe
- Mute
- Subscribe to RSS Feed
- Permalink
- Report Inappropriate Content
Hi,
Thanks for your reply.
1) Is there any way to send you the schematics privately?
-- Maybe you can send a download link via the private message
1) Is this a knonw issue?
-- No.
Have a great day,
TIC
-------------------------------------------------------------------------------
Note:
- If this post answers your question, please click the "Mark Correct" button. Thank you!
- We are following threads for 7 weeks after the last post, later replies are ignored
Please open a new thread and refer to the closed one, if you have a related question at a later point in time.
-------------------------------------------------------------------------------
- Mark as New
- Bookmark
- Subscribe
- Mute
- Subscribe to RSS Feed
- Permalink
- Report Inappropriate Content
- Mark as New
- Bookmark
- Subscribe
- Mute
- Subscribe to RSS Feed
- Permalink
- Report Inappropriate Content
Hi,
Thanks for your reply.
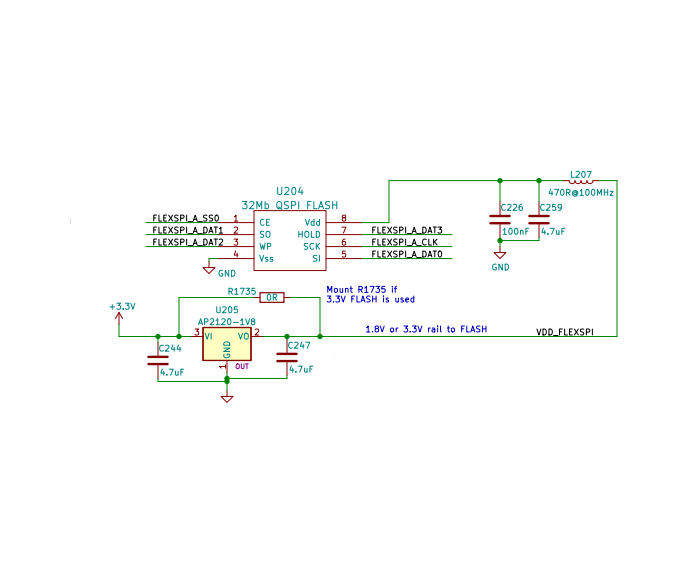
Actually, I've not found something wrong after checking the above picture, further, the Flash configuration is good.
Did you already use the NXP-MCUBootUtility for testing? Moreover, does it encounter a similar issue when debugging the demos from the SDK library for the RT106x?
Have a great day,
TIC
-------------------------------------------------------------------------------
Note:
- If this post answers your question, please click the "Mark Correct" button. Thank you!
- We are following threads for 7 weeks after the last post, later replies are ignored
Please open a new thread and refer to the closed one, if you have a related question at a later point in time.
-------------------------------------------------------------------------------
- Mark as New
- Bookmark
- Subscribe
- Mute
- Subscribe to RSS Feed
- Permalink
- Report Inappropriate Content
I have been trying to get the NXP-MCUBoot utility to work but it refuses to connect over lpuart1. What test can it perform? I cant find anything about flash testing in the description of the tool.
Yes, we see the same issues when debugging the the sdk examples.
Thanks
/Björn
- Mark as New
- Bookmark
- Subscribe
- Mute
- Subscribe to RSS Feed
- Permalink
- Report Inappropriate Content
Hi,
Thanks for your reply.
1) What test can it perform? I can't find anything about flash testing in the description of the tool.
-- During building connection with the NXP-MCUBoot utility, it will configure the external memory device, if it fails, it illustrates there's something wrong with the hardware.
Further, you can use either LPUART1 (GPIO_AD_B0_12 and GPIO_AD_B0_13)or USB OTG1 to connect the tool.
Have a great day,
TIC
-------------------------------------------------------------------------------
Note:
- If this post answers your question, please click the "Mark Correct" button. Thank you!
- We are following threads for 7 weeks after the last post, later replies are ignored
Please open a new thread and refer to the closed one, if you have a related question at a later point in time.
-------------------------------------------------------------------------------