- Forums
- Product Forums
- General Purpose MicrocontrollersGeneral Purpose Microcontrollers
- i.MX Forumsi.MX Forums
- QorIQ Processing PlatformsQorIQ Processing Platforms
- Identification and SecurityIdentification and Security
- Power ManagementPower Management
- Wireless ConnectivityWireless Connectivity
- RFID / NFCRFID / NFC
- Advanced AnalogAdvanced Analog
- MCX Microcontrollers
- S32G
- S32K
- S32V
- MPC5xxx
- Other NXP Products
- S12 / MagniV Microcontrollers
- Powertrain and Electrification Analog Drivers
- Sensors
- Vybrid Processors
- Digital Signal Controllers
- 8-bit Microcontrollers
- ColdFire/68K Microcontrollers and Processors
- PowerQUICC Processors
- OSBDM and TBDML
- S32M
- S32Z/E
-
- Solution Forums
- Software Forums
- MCUXpresso Software and ToolsMCUXpresso Software and Tools
- CodeWarriorCodeWarrior
- MQX Software SolutionsMQX Software Solutions
- Model-Based Design Toolbox (MBDT)Model-Based Design Toolbox (MBDT)
- FreeMASTER
- eIQ Machine Learning Software
- Embedded Software and Tools Clinic
- S32 SDK
- S32 Design Studio
- GUI Guider
- Zephyr Project
- Voice Technology
- Application Software Packs
- Secure Provisioning SDK (SPSDK)
- Processor Expert Software
- Generative AI & LLMs
-
- Topics
- Mobile Robotics - Drones and RoversMobile Robotics - Drones and Rovers
- NXP Training ContentNXP Training Content
- University ProgramsUniversity Programs
- Rapid IoT
- NXP Designs
- SafeAssure-Community
- OSS Security & Maintenance
- Using Our Community
-
- Cloud Lab Forums
-
- Knowledge Bases
- ARM Microcontrollers
- i.MX Processors
- Identification and Security
- Model-Based Design Toolbox (MBDT)
- QorIQ Processing Platforms
- S32 Automotive Processing Platform
- Wireless Connectivity
- CodeWarrior
- MCUXpresso Suite of Software and Tools
- MQX Software Solutions
- RFID / NFC
- Advanced Analog
-
- NXP Tech Blogs
- Home
- :
- i.MX フォーラム
- :
- i.MXプロセッサ
- :
- Debugging Linux Kernel over JTAG with J-Link
Debugging Linux Kernel over JTAG with J-Link
- RSS フィードを購読する
- トピックを新着としてマーク
- トピックを既読としてマーク
- このトピックを現在のユーザーにフロートします
- ブックマーク
- 購読
- ミュート
- 印刷用ページ
Debugging Linux Kernel over JTAG with J-Link
- 新着としてマーク
- ブックマーク
- 購読
- ミュート
- RSS フィードを購読する
- ハイライト
- 印刷
- 不適切なコンテンツを報告
Hi All,
My custom hardware is iMAX6Q processor based and similar to Nitrogen 6 max.
I'm referring to this link >> Debugging using Segger J-Link JTAG - Boundary Devices https://boundarydevices.com/debugging-using-segger-j-link-jtag/https://boundarydevices.com/debugging-using-segger-j-link-jtag/
1) In which boot mode we need to set the board when we are doing the kernel debug ? Do we need to load kernel via SD card ?
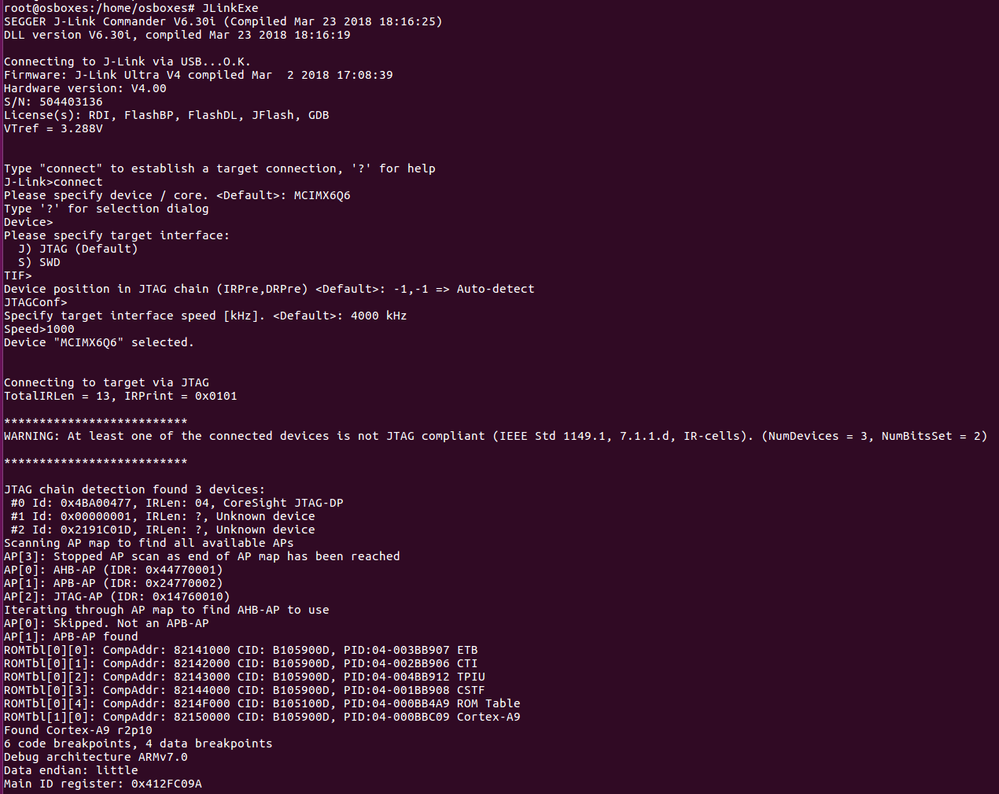
2) First I connected target hardware to JLink. Why it is showing No source available for 0x8ff532d4 ? Canyou see any mistake in following configurations. ?
Next ran the Eclipse.
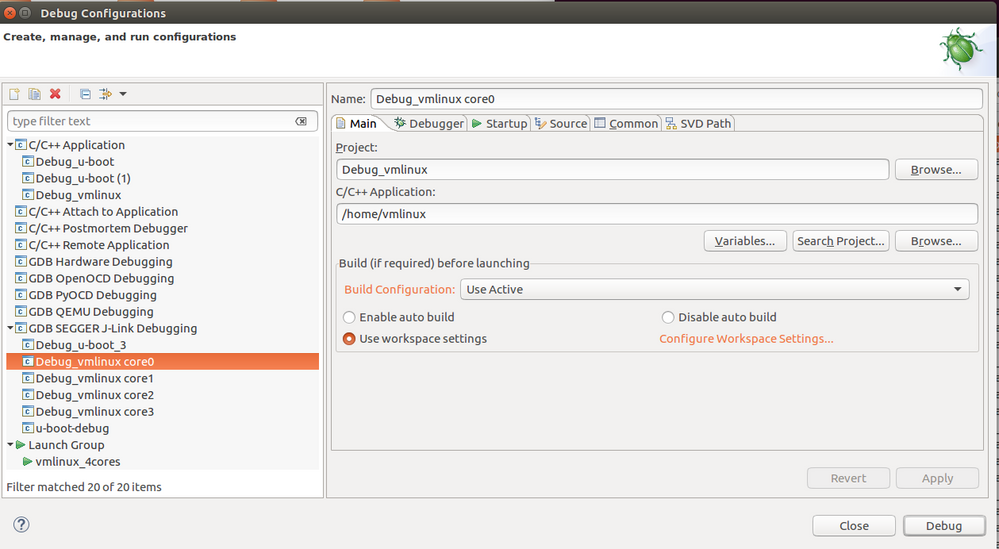
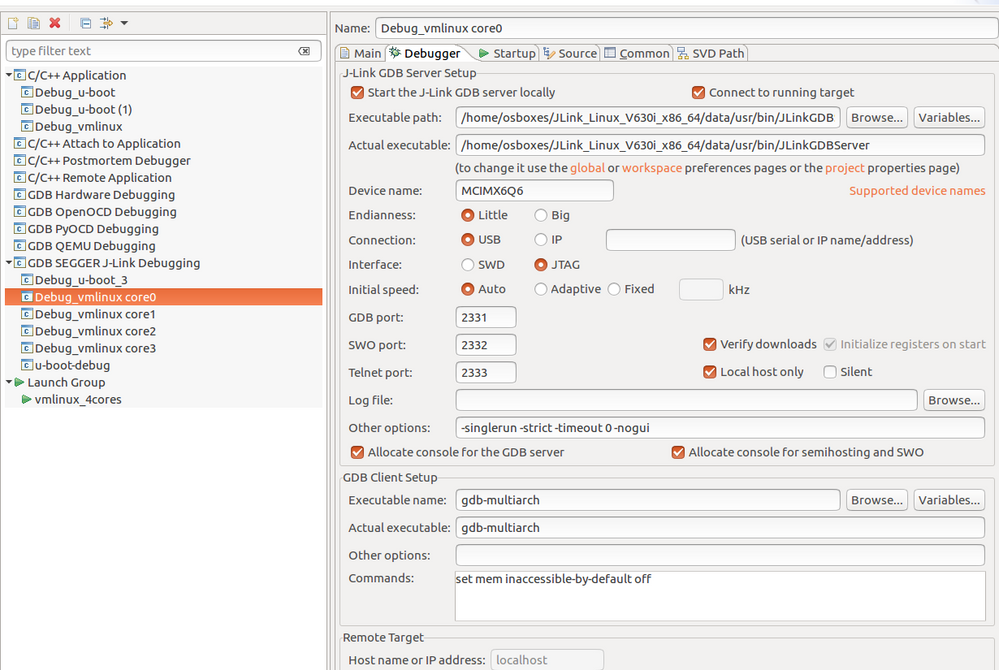
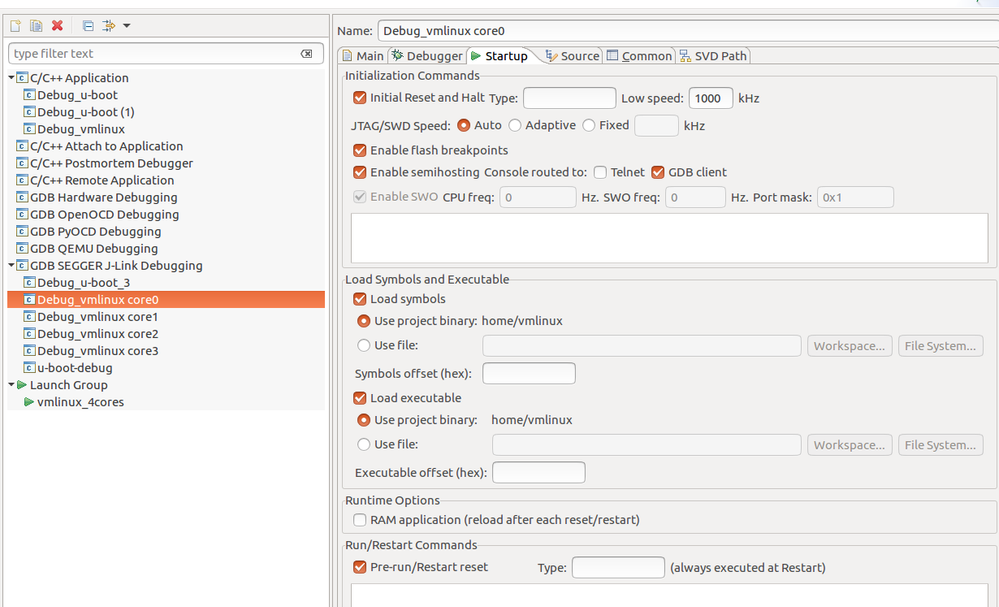
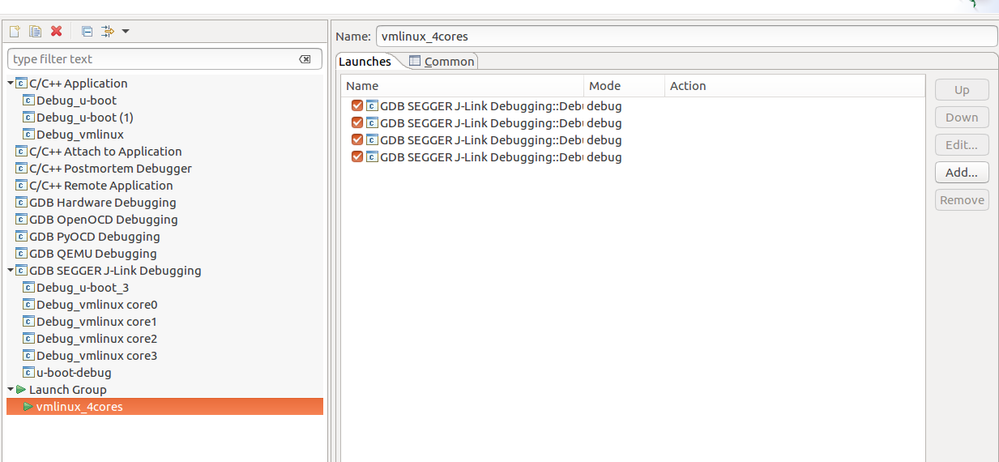
Debug configurations as follows.
Launch Group as follows.
When I hit Debug I got following results.
Here is the Console log. >>
SEGGER J-Link GDB Server V6.30i Command Line Version
JLinkARM.dll V6.30i (DLL compiled Mar 23 2018 18:16:19)
Command line: -if jtag -device MCIMX6Q6 -endian little -speed auto -port 2340 -swoport 2341 -telnetport 2342 -vd -noreset -noir -localhostonly 1 -log /home/script/MCIMX6-core-3.JLinkScript -scriptfile MCIMX6-core-3.JLinkScript
-----GDB Server start settings-----
GDBInit file: none
GDB Server Listening port: 2340
SWO raw output listening port: 2341
Terminal I/O port: 2342
Accept remote connection: localhost only
Generate logfile: on
Verify download: on
Init regs on start: off
Silent mode: off
Single run mode: off
Target connection timeout: 0 ms
------J-Link related settings------
J-Link Host interface: USB
J-Link script: MCIMX6-core-3.JLinkScript
J-Link settings file: none
------Target related settings------
Target device: MCIMX6Q6
Target interface: JTAG
Target interface speed: auto
Target endian: little
Connecting to J-Link...
J-Link is connected.
Firmware: J-Link Ultra V4 compiled Mar 2 2018 17:08:39
Hardware: V4.00
S/N: 504403136
Feature(s): RDI, FlashBP, FlashDL, JFlash, GDB
Checking target voltage...
Target voltage: 3.29 V
Listening on TCP/IP port 2340
Connecting to target...WARNING: At least one of the connected devices is not JTAG compliant (IEEE Std 1149.1, 7.1.1.d, IR-cells). (NumDevices = 3, NumBitsSet = 2)
WARNING: At least one of the connected devices is not JTAG compliant (IEEE Std 1149.1, 7.1.1.d, IR-cells). (NumDevices = 3, NumBitsSet = 2)
J-Link found 3 JTAG devices, Total IRLen = 13
JTAG ID: 0x4BA00477 (Cortex-A9)
Connected to target
Waiting for GDB connection...Connected to 127.0.0.1
Reading all registers
Read 4 bytes @ address 0x8FF532D4 (Data = 0xEBFFFF3E)
Read 4 bytes @ address 0x8FF532D0 (Data = 0xEAFFFFCB)
Read 4 bytes @ address 0x8FF532D4 (Data = 0xEBFFFF3E)
Read 4 bytes @ address 0x8FF532D0 (Data = 0xEAFFFFCB)
Read 2 bytes @ address 0x8FF532D4 (Data = 0xFF3E)
Read 2 bytes @ address 0x8FF532D2 (Data = 0xEAFF)
Read 2 bytes @ address 0x8FF532D0 (Data = 0xFFCB)
Read 2 bytes @ address 0x8FF532D4 (Data = 0xFF3E)
Read 2 bytes @ address 0x8FF532D2 (Data = 0xEAFF)
Read 2 bytes @ address 0x8FF532D0 (Data = 0xFFCB)
Read 4 bytes @ address 0x8FF532D4 (Data = 0xEBFFFF3E)
Read 4 bytes @ address 0x8FF532D0 (Data = 0xEAFFFFCB)
Read 4 bytes @ address 0x8FF532D4 (Data = 0xEBFFFF3E)
Read 4 bytes @ address 0x8FF532D0 (Data = 0xEAFFFFCB)
Read 4 bytes @ address 0x8FF532D4 (Data = 0xEBFFFF3E)
Read 4 bytes @ address 0x8FF532D4 (Data = 0xEBFFFF3E)
Read 4 bytes @ address 0x8FF532D4 (Data = 0xEBFFFF3E)
Read 4 bytes @ address 0x00000001 (Data = 0x1CE59FF0)
Read 4 bytes @ address 0x1CE59FE8 (Data = 0x1187202C)
Received monitor command: speed 1000
Target interface speed set to 1000 kHz
Received monitor command: speed auto
Select auto target interface speed (1000 kHz)
Received monitor command: flash breakpoints 1
Flash breakpoints enabled
Received monitor command: semihosting enable
Semi-hosting enabled (SVC Addr = 0x08)
Received monitor command: semihosting IOClient 2
Semihosting I/O set to GDB Client
Read 4 bytes @ address 0x8FF532D4 (Data = 0xEBFFFF3E)
Read 4 bytes @ address 0x8FF532D0 (Data = 0xEAFFFFCB)
Read 4 bytes @ address 0x8FF532D4 (Data = 0xEBFFFF3E)
Read 4 bytes @ address 0x8FF532D0 (Data = 0xEAFFFFCB)
Read 2 bytes @ address 0x8FF532D4 (Data = 0xFF3E)
Read 2 bytes @ address 0x8FF532D2 (Data = 0xEAFF)
Read 2 bytes @ address 0x8FF532D0 (Data = 0xFFCB)
Read 2 bytes @ address 0x8FF532D4 (Data = 0xFF3E)
Read 2 bytes @ address 0x8FF532D2 (Data = 0xEAFF)
Read 2 bytes @ address 0x8FF532D0 (Data = 0xFFCB)
Read 4 bytes @ address 0x8FF532D4 (Data = 0xEBFFFF3E)
Read 4 bytes @ address 0x8FF532D0 (Data = 0xEAFFFFCB)
Read 4 bytes @ address 0x8FF532D4 (Data = 0xEBFFFF3E)
Read 4 bytes @ address 0x8FF532D0 (Data = 0xEAFFFFCB)
Read 4 bytes @ address 0x8FF532D4 (Data = 0xEBFFFF3E)
Read 4 bytes @ address 0x8FF532D4 (Data = 0xEBFFFF3E)
Read 4 bytes @ address 0x8FF532D4 (Data = 0xEBFFFF3E)
Read 4 bytes @ address 0x00000001 (Data = 0x1CE59FF0)
Read 4 bytes @ address 0x1CE59FE8 (Data = 0x1187202C)
Read 4 bytes @ address 0x8FF5301C (Data = 0xE3500000)
Read 4 bytes @ address 0x8FF53018 (Data = 0xE12FFF33)
Read 4 bytes @ address 0x8FF5301C (Data = 0xE3500000)
Read 4 bytes @ address 0x8FF53018 (Data = 0xE12FFF33)
Read 2 bytes @ address 0x8FF5301C (Data = 0x0000)
Read 2 bytes @ address 0x8FF5301A (Data = 0xE12F)
Read 2 bytes @ address 0x8FF53018 (Data = 0xFF33)
Read 2 bytes @ address 0x8FF5301C (Data = 0x0000)
Read 2 bytes @ address 0x8FF5301A (Data = 0xE12F)
Read 2 bytes @ address 0x8FF53018 (Data = 0xFF33)
Read 4 bytes @ address 0x8FF5301C (Data = 0xE3500000)
Read 4 bytes @ address 0x8FF53018 (Data = 0xE12FFF33)
Read 4 bytes @ address 0x8FF5301C (Data = 0xE3500000)
Read 4 bytes @ address 0x8FF53018 (Data = 0xE12FFF33)
Read 4 bytes @ address 0x8FF5301C (Data = 0xE3500000)
Read 4 bytes @ address 0x8FF5301C (Data = 0xE3500000)
Read 4 bytes @ address 0x8FF5301C (Data = 0xE3500000)
Read 4 bytes @ address 0x00000001 (Data = 0x1CE59FF0)
Read 4 bytes @ address 0x1CE59FE8 (Data = 0x1187202C)
Received monitor command: regs
PC = 8FF532D4, CPSR = 600001D3 (SVC mode, ARM FIQ dis. IRQ dis.)
R0 = 00000000, R1 = 8FFBA1C1, R2 = 00000000, R3 = 00000001
R4 = 8FFB7694, R5 = 00000000, R6 = 8FFB9FAF, R7 = 00000001
USR: R8 =8FFA1298, R9 =8F335ED0, R10=8FF9269A, R11 =00000001, R12 =00002814
R13=00000000, R14=00000000
FIQ: R8 =00000000, R9 =00000000, R10=00000000, R11 =00000000, R12 =00000000
R13=00000000, R14=00000000, SPSR=D0010BB0
SVC: R13=8F335D88, R14=8FF5301C, SPSR=A20444BB
ABT: R13=00000000, R14=00000000, SPSR=80041A0C
IRQ: R13=00000000, R14=00000000, SPSR=8000902D
UND: R13=00000000, R14=00000000, SPSR=40030403
Reading all registers
Read 4 bytes @ address 0x8FF532D4 (Data = 0xEBFFFF3E)
Read 4 bytes @ address 0x8FF532D0 (Data = 0xEAFFFFCB)
Read 4 bytes @ address 0x8FF532D4 (Data = 0xEBFFFF3E)
Read 4 bytes @ address 0x8FF532D0 (Data = 0xEAFFFFCB)
Read 2 bytes @ address 0x8FF532D4 (Data = 0xFF3E)
Read 2 bytes @ address 0x8FF532D2 (Data = 0xEAFF)
Read 2 bytes @ address 0x8FF532D0 (Data = 0xFFCB)
Read 2 bytes @ address 0x8FF532D4 (Data = 0xFF3E)
Read 2 bytes @ address 0x8FF532D2 (Data = 0xEAFF)
Read 2 bytes @ address 0x8FF532D0 (Data = 0xFFCB)
Read 4 bytes @ address 0x8FF532D4 (Data = 0xEBFFFF3E)
Read 4 bytes @ address 0x8FF532D0 (Data = 0xEAFFFFCB)
Read 4 bytes @ address 0x8FF532D4 (Data = 0xEBFFFF3E)
Read 4 bytes @ address 0x8FF532D0 (Data = 0xEAFFFFCB)
Read 4 bytes @ address 0x8FF532D4 (Data = 0xEBFFFF3E)
Read 4 bytes @ address 0x8FF532D4 (Data = 0xEBFFFF3E)
Read 4 bytes @ address 0x8FF532D4 (Data = 0xEBFFFF3E)
Read 4 bytes @ address 0x00000001 (Data = 0x1CE59FF0)
Read 4 bytes @ address 0x1CE59FE8 (Data = 0x1187202C)
Starting target CPU...
3) While running an application on linux in my custom hardware design I'm getting kernel panics. How can I debug this using JTAG ?
4) How can I give certain command to run an application on custom hardware and get information when it is crashing using JTAG ?
Could you please give me some idea regarding this ?
Regards,
Peter.
- 新着としてマーク
- ブックマーク
- 購読
- ミュート
- RSS フィードを購読する
- ハイライト
- 印刷
- 不適切なコンテンツを報告
Hello,
Please look at my comments below.
1.
Use Serial (USB) downloader mode for JTAG debugging; perform memory init
script and try to run bootloader (U-boot) and / or kernel under JTAG.
2.
Linux applications may be debugged, using the GDB, without JTAG, assuming applications
are built with debug support.
Have a great day,
Yuri
-----------------------------------------------------------------------------------------------------------------------
Note: If this post answers your question, please click the Correct Answer button. Thank you!
-----------------------------------------------------------------------------------------------------------------------
- 新着としてマーク
- ブックマーク
- 購読
- ミュート
- RSS フィードを購読する
- ハイライト
- 印刷
- 不適切なコンテンツを報告
Dear @Yuri Muhin,
Thank you for your feedback. I'm getting kernel panics while running linux application on my custom hardware design. But another custom hardware which is similar to this can run this linux application without any problem. I did the memory calibration and stress app test for this board. But there was not any issue related to memory. So how can I debug this to clarify whether this is hardware or software problem. I could debug kernel and uboot using JTAG properly. But how can I pinpoint the issue for this kernel panic while running certain application ?
Here is the panic message (LOG)
[ 308.268356] Unable to handle kernel paging request at virtual address 54494156
[ 308.275647] pgd = 80004000
[ 308.278365] [54494156] *pgd=00000000
[ 308.281977] Internal error: Oops: 80000005 [#1] PREEMPT SMP ARM
[ 308.287904] Modules linked in: tw6869 mxc_v4l2_capture ipu_bg_overlay_sdc ipu_still ipu_prp_enc videobuf2_dma_contig ipu_csi_enc videobuf2_memops adv7610_video ipu_fg_overlay_sdc v4l2_int_device galcore(O)
[ 308.306375] CPU: 3 PID: 0 Comm: swapper/3 Tainted: G O 4.1.15-2.0.0-ga+yocto+gff4e28b #1
[ 308.309584] tw6869 0000:01:00.0: tw6869_querystd: vch1: unknown std detected
[ 308.322648] Hardware name: Freescale i.MX6 Quad/DualLite (Device Tree)
[ 308.329184] task: ce11bc00 ti: ce14c000 task.ti: ce14c000
[ 308.334598] PC is at 0x54494156
[ 308.337766] LR is at cpuidle_enter_state+0x90/0x350
[ 308.342650] pc : [<54494156>] lr : [<806d59b0>] psr: 800b00b3
[ 308.342650] sp : ce14df30 ip : 00000017 fp : ce14df8c
[ 308.354132] r10: 80e02508 r9 : 80e08ad0 r8 : 80d9b880
[ 308.359361] r7 : 00000001 r6 : 80e88160 r5 : 00000047 r4 : c04b271c
[ 308.365892] r3 : 54494157 r2 : 00000000 r1 : 80e08a80 r0 : 80d9b880
[ 308.372430] Flags: Nzcv IRQs off FIQs on Mode SVC_32 ISA Thumb Segment kernel
[ 308.380004] Control: 10c5387d Table: 5f38404a DAC: 00000015
[ 308.385755] Process swapper/3 (pid: 0, stack limit = 0xce14c210)
[ 308.391768] Stack: (0xce14df30 to 0xce14e000)
[ 308.396135] df20: 00000000 d0f2c140 c04b271c 00000047
[ 308.404333] df40: 00000000 00000000 004832f1 00000000 c04b271c 00000047 00000000 dc8ba30f
[ 308.412537] df60: 80d97320 ce14c000 80e025e8 80e88160 d0f2bed0 80e08a74 80a02970 ce14dfa0
[ 308.420738] df80: ce14df9c ce14df90 806d5cc0 806d592c ce14dfdc ce14dfa0 80171a74 806d5ca8
[ 308.428939] dfa0: 80d9b880 80d9b880 00000000 80e02e00 80e025f0 80e878ea 00000001 80c09164
[ 308.437140] dfc0: 80d9aec8 80d97300 10c0387d 80e8d35c ce14dff4 ce14dfe0 8010fae0 801717d8
[ 308.445340] dfe0: 5e12c06a 00000015 00000000 ce14dff8 1010162c 8010f994 00000000 00000000
[ 308.453529] Backtrace:
[ 308.456036] [<806d5920>] (cpuidle_enter_state) from [<806d5cc0>] (cpuidle_enter+0x24/0x28)
[ 308.464320] r10:ce14dfa0 r9:80a02970 r8:80e08a74 r7:d0f2bed0 r6:80e88160 r5:80e025e8
[ 308.472277] r4:ce14c000
[ 308.474868] [<806d5c9c>] (cpuidle_enter) from [<80171a74>] (cpu_startup_entry+0x2a8/0x43c)
[ 308.483171] [<801717cc>] (cpu_startup_entry) from [<8010fae0>] (secondary_start_kernel+0x158/0x164)
[ 308.492232] r7:80e8d35c
[ 308.494813] [<8010f988>] (secondary_start_kernel) from [<1010162c>] (0x1010162c)
[ 308.502223] r5:00000015 r4:5e12c06a
[ 308.505862] Code: bad PC value
[ 308.508940] ---[ end trace 1d6a0d2b2019793f ]---
[ 308.513579] Kernel panic - not syncing: Attempted to kill the idle task!
[ 308.520313] CPU1: stopping
[ 308.523060] CPU: 1 PID: 37 Comm: cfinteractive Tainted: G D O 4.1.15-2.0.0-ga+yocto+gff4e28b #1
[ 308.532731] Hardware name: Freescale i.MX6 Quad/DualLite (Device Tree)
[ 308.539274] Backtrace:
[ 308.541792] [<8010c358>] (dump_backtrace) from [<8010c5d4>] (show_stack+0x20/0x24)
[ 308.549379] r7:80e87b48 r6:80e45ca0 r5:00000000 r4:80e45ca0
[ 308.555168] [<8010c5b4>] (show_stack) from [<80919780>] (dump_stack+0x7c/0xbc)
[ 308.562421] [<80919704>] (dump_stack) from [<80110038>] (handle_IPI+0x2e4/0x2f8)
[ 308.569831] r7:80e87b48 r6:00000005 r5:80d99c34 r4:80d99c34
[ 308.575608] [<8010fd54>] (handle_IPI) from [<80101594>] (gic_handle_irq+0x68/0x6c)
[ 308.583192] r10:00000002 r9:ce020000 r8:00000001 r7:f4a00100 r6:ce321b28 r5:80e02f7c
[ 308.591152] r4:f4a0010c r3:ce321b28
[ 308.594795] [<8010152c>] (gic_handle_irq) from [<8010d240>] (__irq_svc+0x40/0x74)
[ 308.602295] Exception stack(0xce321b28 to 0xce321b70)
[ 308.607371] 1b20: 00000001 80bbbbd4 80e8f9c0 00000000 ffffe000 80e8f9c0
[ 308.615572] 1b40: 00000010 00000000 00000001 ce020000 00000002 ce321bd4 ce321b60 ce321b70
[ 308.623769] 1b60: 80493dc0 80137668 200f0113 ffffffff
[ 308.628833] r7:ce321b5c r6:ffffffff r5:200f0113 r4:80137668
[ 308.634617] [<801375b4>] (__do_softirq) from [<80137c20>] (irq_exit+0xd0/0x10c)
[ 308.641940] r10:ce321c40 r9:ce020000 r8:00000001 r7:00000000 r6:00000010 r5:00000000
[ 308.649901] r4:80d99c34
[ 308.652491] [<80137b50>] (irq_exit) from [<8017beb4>] (__handle_domain_irq+0x90/0xfc)
[ 308.660335] r5:00000000 r4:80d99c34
[ 308.663984] [<8017be24>] (__handle_domain_irq) from [<80101560>] (gic_handle_irq+0x34/0x6c)
[ 308.672348] r10:00000004 r9:ce321d90 r8:00000001 r7:f4a00100 r6:ce321c40 r5:80e02f7c
[ 308.680311] r4:f4a0010c r3:ce321c40
[ 308.683954] [<8010152c>] (gic_handle_irq) from [<8010d240>] (__irq_svc+0x40/0x74)
[ 308.691453] Exception stack(0xce321c40 to 0xce321c88)
[ 308.696528] 1c40: 00000003 d0f2f89c 00000003 00000003 80e02650 d0f13180 80e02e00 d0f13184
[ 308.704729] 1c60: 00000001 ce321d90 00000004 ce321cbc 00000003 ce321c88 801a739c 801a73cc
[ 308.712923] 1c80: 200f0013 ffffffff
[ 308.716425] r7:ce321c74 r6:ffffffff r5:200f0013 r4:801a73cc
[ 308.722208] [<801a715c>] (smp_call_function_many) from [<801a7468>] (smp_call_function+0x48/0x88)
[ 308.731093] r10:ffffffff r9:ce321d88 r8:00000000 r7:00000000 r6:00000001 r5:ce321d90
[ 308.739054] r4:80110990
[ 308.741634] [<801a7420>] (smp_call_function) from [<801a74e0>] (on_each_cpu+0x38/0x90)
[ 308.749564] r7:00000000 r6:00000001 r5:ce321d90 r4:80110990
[ 308.755342] [<801a74a8>] (on_each_cpu) from [<80110d2c>] (twd_rate_change+0x38/0x40)
[ 308.763099] r7:00000000 r6:00000002 r5:ce321d88 r4:ffffffff
[ 308.768890] [<80110cf4>] (twd_rate_change) from [<801523c4>] (notifier_call_chain+0x54/0x94)
[ 308.777357] [<80152370>] (notifier_call_chain) from [<80152894>] (__srcu_notifier_call_chain+0x54/0x70)
[ 308.786763] r9:ce321d88 r8:00000002 r7:00000000 r6:00000000 r5:ce0a6184 r4:ce0a619c
[ 308.794650] [<80152840>] (__srcu_notifier_call_chain) from [<801528d8>] (srcu_notifier_call_chain+0x28/0x30)
[ 308.804491] r10:00000000 r9:80e8a384 r8:00000002 r7:80e02508 r6:ce026000 r5:80e73b44
[ 308.812451] r4:ce0a6180
[ 308.815042] [<801528b0>] (srcu_notifier_call_chain) from [<80746114>] (__clk_notify+0xa0/0xa8)
[ 308.823683] [<80746074>] (__clk_notify) from [<807461c4>] (__clk_recalc_rates+0xa8/0xac)
[ 308.831786] r8:ce003f80 r7:00000001 r6:1daee080 r5:00000002 r4:ce026000
[ 308.838630] [<8074611c>] (__clk_recalc_rates) from [<80746198>] (__clk_recalc_rates+0x7c/0xac)
[ 308.847254] r7:00000001 r6:3b5dc100 r5:00000002 r4:ce026000
[ 308.853030] [<8074611c>] (__clk_recalc_rates) from [<80746198>] (__clk_recalc_rates+0x7c/0xac)
[ 308.861654] r7:00000001 r6:3b5dc100 r5:00000002 r4:ce026a80
[ 308.867438] [<8074611c>] (__clk_recalc_rates) from [<80748b50>] (clk_core_set_parent+0x1bc/0x2dc)
[ 308.876324] r7:00000001 r6:00000000 r5:ce026380 r4:ce026400
[ 308.882102] [<80748994>] (clk_core_set_parent) from [<80748c9c>] (clk_set_parent+0x2c/0x30)
[ 308.890467] r9:00000000 r8:179a7b00 r7:80e02508 r6:000f32a0 r5:00060ae0 r4:80eec6ac
[ 308.898357] [<80748c70>] (clk_set_parent) from [<806d4220>] (imx6q_set_target+0x490/0x544)
[ 308.906653] [<806d3d90>] (imx6q_set_target) from [<806ca034>] (__cpufreq_driver_target+0x184/0x2b0)
[ 308.915712] r10:00000000 r9:00000000 r8:80eec5e4 r7:00000000 r6:80e02508 r5:ce66b500
[ 308.923671] r4:00000000
[ 308.926253] [<806c9eb0>] (__cpufreq_driver_target) from [<806d2d44>] (cpufreq_interactive_speedchange_task+0x264/0x354)
[ 308.937048] r10:80d9ae10 r9:80e02650 r8:80e02e00 r7:00000000 r6:000f32a0 r5:80d9ae10
[ 308.945007] r4:d0f1ee10
[ 308.947591] [<806d2ae0>] (cpufreq_interactive_speedchange_task) from [<801514e4>] (kthread+0xfc/0x114)
[ 308.956911] r10:00000000 r9:00000000 r8:00000000 r7:806d2ae0 r6:00000000 r5:ce303480
[ 308.964870] r4:00000000
[ 308.967456] [<801513e8>] (kthread) from [<80108028>] (ret_from_fork+0x14/0x2c)
[ 308.974692] r7:00000000 r6:00000000 r5:801513e8 r4:ce303480
[ 308.980460] CPU0: stopping
[ 308.983202] CPU: 0 PID: 0 Comm: swapper/0 Tainted: G D O 4.1.15-2.0.0-ga+yocto+gff4e28b #1
[ 308.992439] Hardware name: Freescale i.MX6 Quad/DualLite (Device Tree)
[ 308.998981] Backtrace:
[ 309.001488] [<8010c358>] (dump_backtrace) from [<8010c5d4>] (show_stack+0x20/0x24)
[ 309.009073] r7:80e87b48 r6:80e45ca0 r5:00000000 r4:80e45ca0
[ 309.014859] [<8010c5b4>] (show_stack) from [<80919780>] (dump_stack+0x7c/0xbc)
[ 309.022112] [<80919704>] (dump_stack) from [<80110038>] (handle_IPI+0x2e4/0x2f8)
[ 309.029522] r7:80e87b48 r6:00000005 r5:80d99c34 r4:80d99c34
[ 309.035298] [<8010fd54>] (handle_IPI) from [<80101594>] (gic_handle_irq+0x68/0x6c)
[ 309.042881] r10:80e02508 r9:80e08b14 r8:d0f04ed0 r7:f4a00100 r6:80e01e98 r5:80e02f7c
[ 309.050843] r4:f4a0010c r3:80e01e98
[ 309.054488] [<8010152c>] (gic_handle_irq) from [<8010d240>] (__irq_svc+0x40/0x74)
[ 309.061987] Exception stack(0x80e01e98 to 0x80e01ee0)
[ 309.067058] 1e80: 00000000 d0f084c0
[ 309.075261] 1ea0: dc8ba30f dc8ba30f cef8dbc4 00000047 80e88160 00000004 d0f04ed0 80e08b14
[ 309.083462] 1ec0: 80e02508 80e01f3c 80e01e80 80e01ee0 8091f2bc 806d59e0 600f0013 ffffffff
[ 309.091652] r7:80e01ecc r6:ffffffff r5:600f0013 r4:806d59e0
[ 309.097430] [<806d5920>] (cpuidle_enter_state) from [<806d5cc0>] (cpuidle_enter+0x24/0x28)
[ 309.105708] r10:80e01f50 r9:80a02970 r8:80e08a74 r7:d0f04ed0 r6:80e88160 r5:80e025e8
[ 309.113667] r4:80e00000
[ 309.116248] [<806d5c9c>] (cpuidle_enter) from [<80171a74>] (cpu_startup_entry+0x2a8/0x43c)
[ 309.124540] [<801717cc>] (cpu_startup_entry) from [<80917448>] (rest_init+0x98/0x9c)
[ 309.132297] r7:80e02500
[ 309.134893] [<809173b0>] (rest_init) from [<80d00d9c>] (start_kernel+0x404/0x424)
[ 309.142390] r5:80e8d000 r4:80e8d04c
[ 309.146037] [<80d00998>] (start_kernel) from [<1000807c>] (0x1000807c)
[ 309.152583] CPU2: stopping
[ 309.155327] CPU: 2 PID: 0 Comm: swapper/2 Tainted: G D O 4.1.15-2.0.0-ga+yocto+gff4e28b #1
[ 309.164565] Hardware name: Freescale i.MX6 Quad/DualLite (Device Tree)
[ 309.171106] Backtrace:
[ 309.173611] [<8010c358>] (dump_backtrace) from [<8010c5d4>] (show_stack+0x20/0x24)
[ 309.181196] r7:80e87b48 r6:80e45ca0 r5:00000000 r4:80e45ca0
[ 309.186977] [<8010c5b4>] (show_stack) from [<80919780>] (dump_stack+0x7c/0xbc)
[ 309.194230] [<80919704>] (dump_stack) from [<80110038>] (handle_IPI+0x2e4/0x2f8)
[ 309.201639] r7:80e87b48 r6:00000005 r5:80d99c34 r4:80d99c34
[ 309.207417] [<8010fd54>] (handle_IPI) from [<80101594>] (gic_handle_irq+0x68/0x6c)
[ 309.215001] r10:80e02508 r9:80e08b14 r8:d0f1eed0 r7:f4a00100 r6:ce14bee8 r5:80e02f7c
[ 309.222960] r4:f4a0010c r3:ce14bee8
[ 309.226604] [<8010152c>] (gic_handle_irq) from [<8010d240>] (__irq_svc+0x40/0x74)
[ 309.234103] Exception stack(0xce14bee8 to 0xce14bf30)
[ 309.239179] bee0: 00000000 d0f224c0 dc8ba30f dc8ba30f ce933307 00000047
[ 309.247383] bf00: 80e88160 00000004 d0f1eed0 80e08b14 80e02508 ce14bf8c ce14bed0 ce14bf30
[ 309.255578] bf20: 8091f2bc 806d59e0 600f0013 ffffffff
[ 309.260643] r7:ce14bf1c r6:ffffffff r5:600f0013 r4:806d59e0
[ 309.266420] [<806d5920>] (cpuidle_enter_state) from [<806d5cc0>] (cpuidle_enter+0x24/0x28)
[ 309.274698] r10:ce14bfa0 r9:80a02970 r8:80e08a74 r7:d0f1eed0 r6:80e88160 r5:80e025e8
[ 309.282656] r4:ce14a000
[ 309.285237] [<806d5c9c>] (cpuidle_enter) from [<80171a74>] (cpu_startup_entry+0x2a8/0x43c)
[ 309.293528] [<801717cc>] (cpu_startup_entry) from [<8010fae0>] (secondary_start_kernel+0x158/0x164)
[ 309.302587] r7:80e8d35c
[ 309.305168] [<8010f988>] (secondary_start_kernel) from [<1010162c>] (0x1010162c)
[ 309.312579] r5:00000015 r4:5e12c06a
[ 309.316221] ---[ end Kernel panic - not syncing: Attempted to kill the idle task!
I must be thankful to you if you can guide me on this issue. Are there any methods for hardware debugging to pinpoint the issues related to this while running applications on linux ?
Regards,
Peter.
- 新着としてマーク
- ブックマーク
- 購読
- ミュート
- RSS フィードを購読する
- ハイライト
- 印刷
- 不適切なコンテンツを報告
