- Forums
- Product Forums
- General Purpose MicrocontrollersGeneral Purpose Microcontrollers
- i.MX Forumsi.MX Forums
- QorIQ Processing PlatformsQorIQ Processing Platforms
- Identification and SecurityIdentification and Security
- Power ManagementPower Management
- Wireless ConnectivityWireless Connectivity
- RFID / NFCRFID / NFC
- MCX Microcontrollers
- S32G
- S32K
- S32V
- MPC5xxx
- Other NXP Products
- S12 / MagniV Microcontrollers
- Powertrain and Electrification Analog Drivers
- Sensors
- Vybrid Processors
- Digital Signal Controllers
- 8-bit Microcontrollers
- ColdFire/68K Microcontrollers and Processors
- PowerQUICC Processors
- OSBDM and TBDML
- S32M
-
- Solution Forums
- Software Forums
- MCUXpresso Software and ToolsMCUXpresso Software and Tools
- CodeWarriorCodeWarrior
- MQX Software SolutionsMQX Software Solutions
- Model-Based Design Toolbox (MBDT)Model-Based Design Toolbox (MBDT)
- FreeMASTER
- eIQ Machine Learning Software
- Embedded Software and Tools Clinic
- S32 SDK
- S32 Design Studio
- GUI Guider
- Zephyr Project
- Voice Technology
- Application Software Packs
- Secure Provisioning SDK (SPSDK)
- Processor Expert Software
-
- Topics
- Mobile Robotics - Drones and RoversMobile Robotics - Drones and Rovers
- NXP Training ContentNXP Training Content
- University ProgramsUniversity Programs
- Rapid IoT
- NXP Designs
- SafeAssure-Community
- OSS Security & Maintenance
- Using Our Community
-
- Cloud Lab Forums
-
- Knowledge Bases
- ARM Microcontrollers
- i.MX Processors
- Identification and Security
- Model-Based Design Toolbox (MBDT)
- QorIQ Processing Platforms
- S32 Automotive Processing Platform
- Wireless Connectivity
- CodeWarrior
- MCUXpresso Suite of Software and Tools
- MQX Software Solutions
-
- Home
- :
- ソフトウェア・フォーラム
- :
- S32 デザインスタジオ
- :
- Re: How attach to running program?
How attach to running program?
- RSS フィードを購読する
- トピックを新着としてマーク
- トピックを既読としてマーク
- このトピックを現在のユーザーにフロートします
- ブックマーク
- 購読
- ミュート
- 印刷用ページ
- 新着としてマーク
- ブックマーク
- 購読
- ミュート
- RSS フィードを購読する
- ハイライト
- 印刷
- 不適切なコンテンツを報告
OS: Ubuntu 18.04.1 LTS
IDE: S32DS Power 2017.R1, Build id: 171018.
Board: Custom equipped with PowerPC MPC5748G
Debugger: P&E Multilink Universal
Sometimes I want to...
- Reset a program from the IDE
- Attach to a running program
- Download a program to the device and debug it
With my usual ARM-debugger (Segger Ozone) there's a button in the main toolbar with a small dropdown for selecting between three actions.
But how do I accomplish these three actions in the S32 Design Studio?
I can download a program using the bug button in the main toolbar
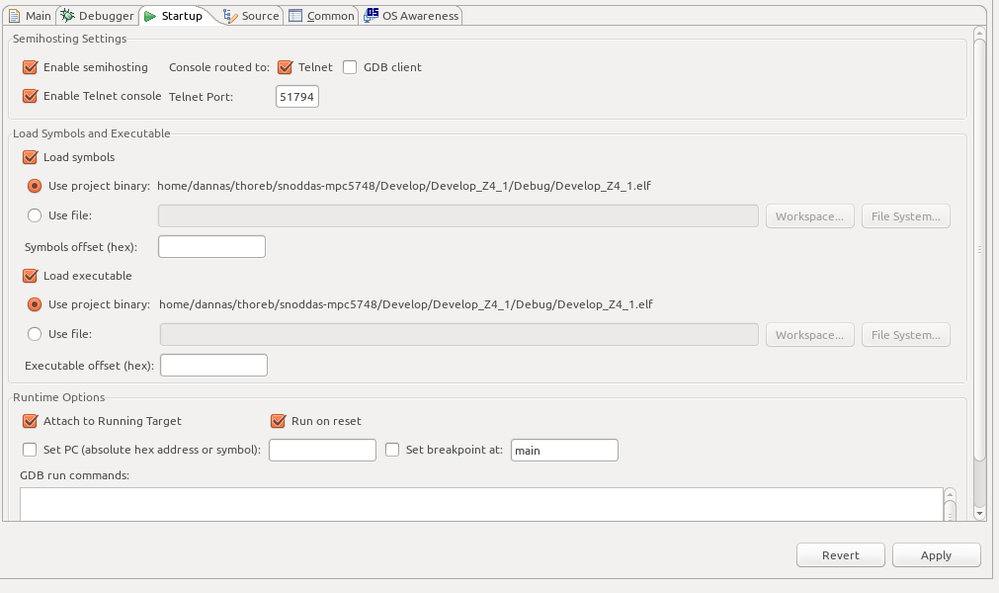
There's a "Attach to Running Target" checkbox field in the Debug Configurations dialog
There's a yellow HW reset button in the Debug View
But the HW reset takes ~30s for me to take effect with a small program. And sometimes it fails completely. Is that expected?
When I want to attach to a program I've filled in the checkbox and started debugging. Sometimes I've succeed in attaching, and sometimes not. And when I've had the Attach to Running Target checkbox filled in by mistake I've started a debug session in the belief that the new version of the software was flashed to the device, when in fact, the debugger just attached to the old running software.
Is there some option that I've missed? Any suggestions on how to configure S32DS to make it clearer if the debugger will just attach or if it will download the program?
解決済! 解決策の投稿を見る。
- 新着としてマーク
- ブックマーク
- 購読
- ミュート
- RSS フィードを購読する
- ハイライト
- 印刷
- 不適切なコンテンツを報告
Hi,
did you update your installatiion of S32DS?
For me with PE Micro Multilink FX takes reset about 3 sec (because of RAM Init).
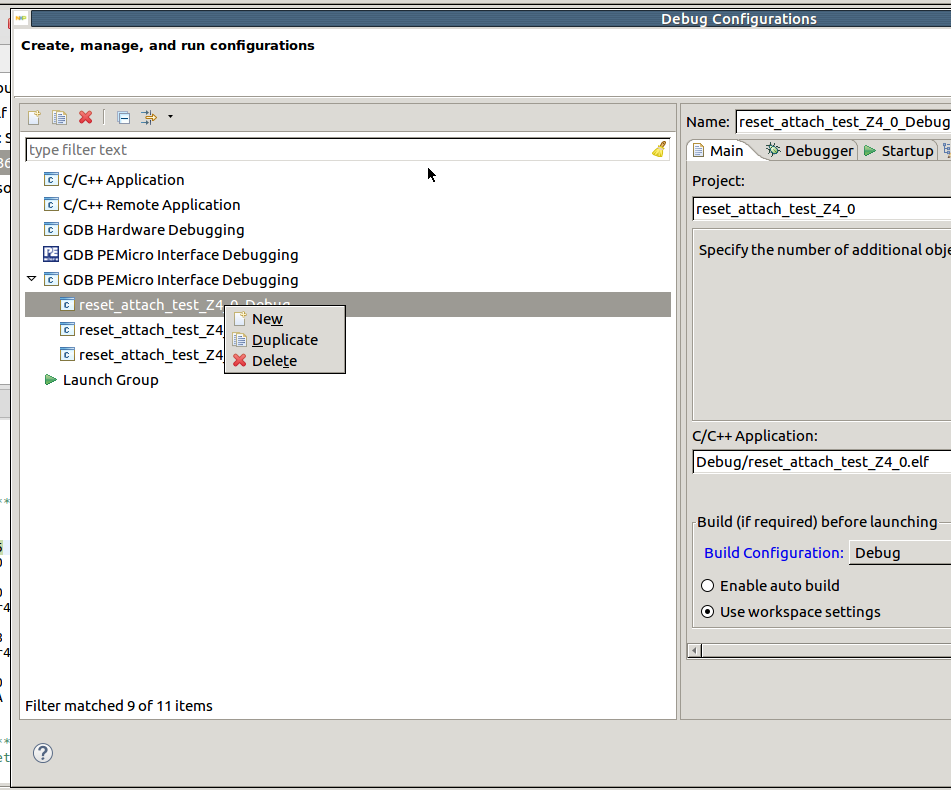
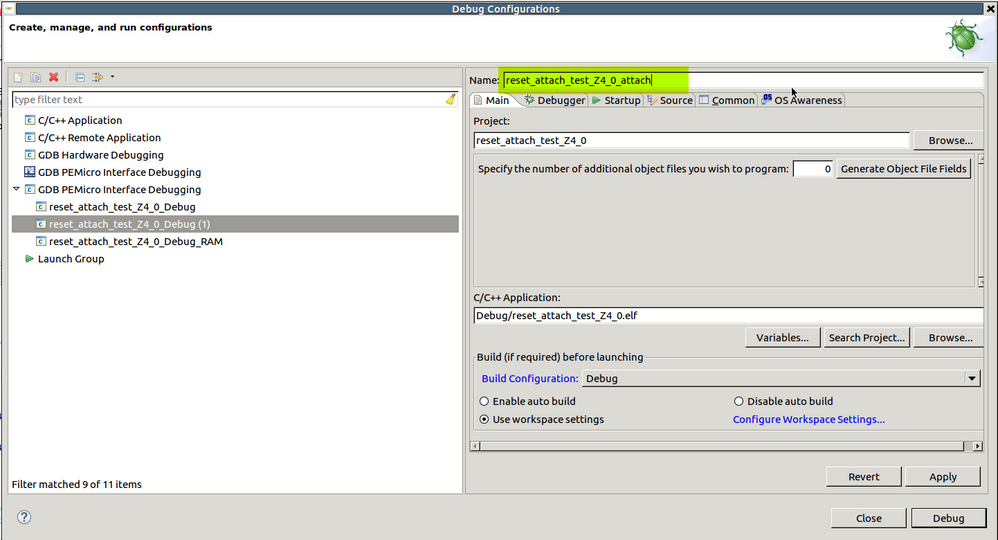
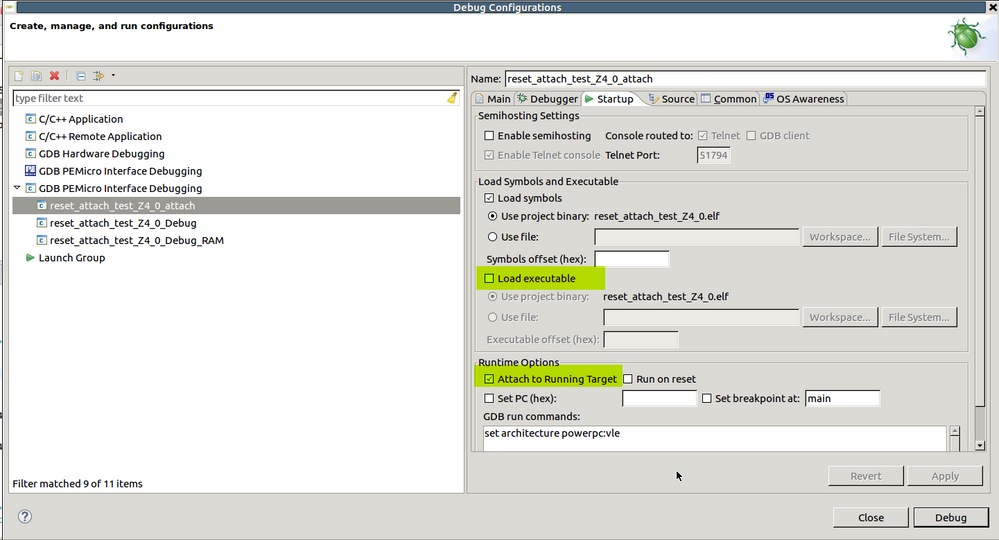
To make attach easier - you can create your own debug settings with attach only. Duplicate existing debug configuration, rename it and configure for attaching:
Hope it helps.
Jiri


