- Forums
- Product Forums
- General Purpose MicrocontrollersGeneral Purpose Microcontrollers
- i.MX Forumsi.MX Forums
- QorIQ Processing PlatformsQorIQ Processing Platforms
- Identification and SecurityIdentification and Security
- Power ManagementPower Management
- Wireless ConnectivityWireless Connectivity
- RFID / NFCRFID / NFC
- Advanced AnalogAdvanced Analog
- MCX Microcontrollers
- S32G
- S32K
- S32V
- MPC5xxx
- Other NXP Products
- S12 / MagniV Microcontrollers
- Powertrain and Electrification Analog Drivers
- Sensors
- Vybrid Processors
- Digital Signal Controllers
- 8-bit Microcontrollers
- ColdFire/68K Microcontrollers and Processors
- PowerQUICC Processors
- OSBDM and TBDML
- S32M
- S32Z/E
-
- Solution Forums
- Software Forums
- MCUXpresso Software and ToolsMCUXpresso Software and Tools
- CodeWarriorCodeWarrior
- MQX Software SolutionsMQX Software Solutions
- Model-Based Design Toolbox (MBDT)Model-Based Design Toolbox (MBDT)
- FreeMASTER
- eIQ Machine Learning Software
- Embedded Software and Tools Clinic
- S32 SDK
- S32 Design Studio
- GUI Guider
- Zephyr Project
- Voice Technology
- Application Software Packs
- Secure Provisioning SDK (SPSDK)
- Processor Expert Software
- Generative AI & LLMs
-
- Topics
- Mobile Robotics - Drones and RoversMobile Robotics - Drones and Rovers
- NXP Training ContentNXP Training Content
- University ProgramsUniversity Programs
- Rapid IoT
- NXP Designs
- SafeAssure-Community
- OSS Security & Maintenance
- Using Our Community
-
- Cloud Lab Forums
-
- Knowledge Bases
- ARM Microcontrollers
- i.MX Processors
- Identification and Security
- Model-Based Design Toolbox (MBDT)
- QorIQ Processing Platforms
- S32 Automotive Processing Platform
- Wireless Connectivity
- CodeWarrior
- MCUXpresso Suite of Software and Tools
- MQX Software Solutions
- RFID / NFC
- Advanced Analog
-
- NXP Tech Blogs
- Home
- :
- ソフトウェア・フォーラム
- :
- S32 デザインスタジオ
- :
- Re: Debugging S32V234 SBC with S32 Debug Probe
Debugging S32V234 SBC with S32 Debug Probe
- RSS フィードを購読する
- トピックを新着としてマーク
- トピックを既読としてマーク
- このトピックを現在のユーザーにフロートします
- ブックマーク
- 購読
- ミュート
- 印刷用ページ
Debugging S32V234 SBC with S32 Debug Probe
- 新着としてマーク
- ブックマーク
- 購読
- ミュート
- RSS フィードを購読する
- ハイライト
- 印刷
- 不適切なコンテンツを報告
My team & I have been trying to use the debug probe with the S32V234 SBC. We have the S32 Design Studio installed on a Windows machine.
When we try to start a debug session for the example project hello_world_s32v234 via the debug configurations "C/C++ Remote Application", we get the error "Could not start gdbserver on the remote host.". If we try to run the command manually on the board, we get the error "Process /home/root/downloads/hello_world_s32v234.elf created; pid = 1054 ../../../gdb-8.0.1/gdb/gdbserver/regcache.c:44: A problem internal to GDBserver has been detected. regcache* get_thread_regcache(thread_info*, int): Assertion `proc->tdesc != NULL' failed. logout".
While if we try to start a debug session for a new empty application project that we've created (S32V234 Cortex-A53 Linux project) via the debug configurations "C/C++ Remote Application", the session starts. But then when we try to start to debug via the debug configuration "S32 Debugger", we get the error "Failure during execution of python script. Reason: Flash error has occurred during starting debug for launch 'new_a53_linux Debug'. Error code is 500.".
We are trying to follow the steps mentioned in this training https://www.nxp.com/design/training/getting-started-with-s32-design-studio-ide:TIP-S32DS-Extension-P... as we want to use the S32 Debug Probe to get detailed debug while running a project on the development board, but this is not possible so far.
- 新着としてマーク
- ブックマーク
- 購読
- ミュート
- RSS フィードを購読する
- ハイライト
- 印刷
- 不適切なコンテンツを報告
Hello Ahmed,
I know this is a bit confusing. The S32 Design Studio supports the use of other debuggers. To debug within S32 Design Studio the A53 while it is running Linux, you must use the Remote GDB debugger. You can configure this within the C/C++ Remote Applications grouping in the Debug Configurations menu. We have a HOWTO on this: HOWTO: S32V234-EVB debugging with Linux and gdbserver on target machine . This article describes how to setup the connection so that it can communicate with the target device and to load the A53 executable to the Linux file system and launch it.
After the Remote Linux debugging session is started, then you can use the S32 Debugger to attach to the additional cores (like APEX and ISP). So the Remote Linux is debugging via the Serial connection and the S32 Debugger is debugging via the JTAG connection.
I hope this clears it up a bit.
Best Regards,
Mike
- 新着としてマーク
- ブックマーク
- 購読
- ミュート
- RSS フィードを購読する
- ハイライト
- 印刷
- 不適切なコンテンツを報告
Hello,
Thank you for your reply. Again your reply gives me some insight, while still raising some questions. Let me try to organize my questions as much as possible.
1- In the reply you wrote on 28.02.2022 22:31 CET, you wrote "the S32 Debugger does not support debugging of a core that has Linux executing. So this means, you can debug the A53 core, but the A53 image must be loaded via the S32 Debugger and not by Linux." Does using a debug configuration from the C/C++ Remote Applications grouping mean that the A53 image is being loaded from via the S32 Debugger and not by Linux? If not, how can we load the A53 image via the S32 Debugger and not by Linux?
2- In the reply you wrote on 08.03.2022 00:14 CET, you wrote "After the Remote Linux debugging session is started, then you can use the S32 Debugger to attach to the additional cores (like APEX and ISP)." Does this mean we can only use S32 Debug Probe to debug the additional cores? Can't we use the S32 Debug Probe to debug the A53?
3- I loaded the example project, isp_sonyimx224_csi_dcu_bareboard. Built the project. Then right clicked the project > Debug As > Debug Configurations... Then under "C/C++ Remote Application" I chose the "isp_sonyimx224_csi_dcu_bareboard Debug" configuration. Then I chose the SSH connection that I've setup with the board, press debug. Then I get the error "'Launching isp_sonyimx224_csi_dcu_bareboard Debug' has encountered a problem. could not start gdbserver on the remote host. See console output for more details."
4- I created a new S32DS Application Project, while choosing the processor 'S32V2 Cortex-A53 Linux'. Built the project. Then right clicked the project > Debug As > Debug Configurations... Then under "C/C++ Remote Application" I chose the "cortex_a53_linux_Debug_Remote_Linux" configuration. Then I chose the SSH connection that I've setup with the board, press debug. Then a debug session via the gdbserver starts. Then I go to menus bar at the top of the IDE, press Run > Debug Configurations... Then under "S32 Debugger" I chose "cortex_a53_linux Debug". Then chose the core APEX0 APU. Pressed Debug. Then I got the error "'Launching cortex_a53_linux Debug' has encountered a problem.
Error in final launch sequence:
Failed to execute MI command:
symbol-file "/home/workspaceS32DS.3.4/cortex_a53_linux/Debug/cortex_a53_linux.elf"
Error message from debugger back end:
`/home/workspaceS32DS.3.4/cortex_a53_linux/Debug/cortex_a53_linux.elf': can't read symbols: File format not recognized.
Failed to execute MI command:
symbol-file "/home/workspaceS32DS.3.4/cortex_a53_linux/Debug/cortex_a53_linux.elf"
Error message from debugger back end:
`/home/workspaceS32DS.3.4/cortex_a53_linux/Debug/cortex_a53_linux.elf': can't read symbols: File format not recognized.
`/home/workspaceS32DS.3.4/cortex_a53_linux/Debug/cortex_a53_linux.elf': can't read symbols: File format not recognized."
- 新着としてマーク
- ブックマーク
- 購読
- ミュート
- RSS フィードを購読する
- ハイライト
- 印刷
- 不適切なコンテンツを報告
Hello Ahmed,
Allow me to try to explain this once more. It seems I have left out some details which are causing confusion.
The S32 Debugger can debug all cores on the S32V234 device. The caveat is, the S32 Debugger does not handle the case where a Linux BSP has been loaded to the EVB either via SD card boot or Flash Memory boot. In either case you must first load the Linux BSP to the memory device and configure the EVB to boot from that device.
When you wish to debug an application which is executing on Linux BSP OS, on the target, you must first load the Linux BSP to the memory device and then configure the EVB to boot from this device. Next you can use the GDB debugger which resides within the Linux BSP which booted from the selected memory device. One way to do this is to use the Remote Applications debugging configuration as you have already done. This method uses the Serial/UART connection between your PC and the EVB to communicate with the Remote GDB and perform debugging activities. The S32 Design Studio in this case is used to send debug commands and to display the communications back from the GDB on the target. The S32 Debugger is not being used, nor is the S32 Debug Probe connected to the EVB via the JTAG cable. The A53 is the only core which is generally used to run Linux OS.
If instead you wish to use the S32 Debugger to debug the A53 core, then you should not boot the EVB from a memory device which has a Linux BSP loaded. The simple way is to configure the board to boot from serial or boot from SD card and remove the SD card. The BootROM firmware on the target will determine that no bootable application is available and default to boot from serial. This way, the Linux OS cannot interfere with the S32 Debugger and you can successfully load an application directly to RAM and debug on the target. This method uses the S32 Debug Probe via JTAG cable.
For all other cores, APEX, ISP, M7, you can use the S32 Debugger without impact from Linux. This method, however, varies between these cores. For M7 core, it can be a boot core so you can use the 's32v234_microsys_bareboard.py' initialization script (C:\NXP\S32DS.3.4\S32DS\tools\S32Debugger\Debugger\scripts\s32v234) in your Debug Configurations menu settings. For the APEX and ISP debugging, you must use the 's32v234_attach.py'. The difference between these scripts is documented in the README.txt file located in the same directory. Briefly, the initialization of the cores is different. In the ...bareboard.py file you have initializations for all of the cores. In the ...attach.py script, there are no initializations of the cores. It assumes this has been done already. The APEX and ISP are generally launched from the A53 core, so you need to follow the instructions in the HOWTO articles to know where in the A53 application to set a breakpoint and start the attach.py for each core. There is a point in the A53 code where the APEX or ISP is initialized and only after this can you start debug on that core.
Please let me know if you still have questions about how this works.
Best Regards,
Mike
- 新着としてマーク
- ブックマーク
- 購読
- ミュート
- RSS フィードを購読する
- ハイライト
- 印刷
- 不適切なコンテンツを報告
Hello,
Thank you, this reply helped understand a lot of things.
I'm currently working on getting my board to boot from the eMMC instead of the SD card to be able to debug the A53 core. I'm following the attached document. In page 4, we are instructed to disconnect the SD card and connect eMMC by switching J37 jumper. The document is addressing the EVB, while I have the SBC. I searched, but I couldn't find any equivalent jumper on my board.
Can you please tell me how to disconnect the SD card and connect eMMC on the SBC?
Best regards,
Ahmed
- 新着としてマーク
- ブックマーク
- 購読
- ミュート
- RSS フィードを購読する
- ハイライト
- 印刷
- 不適切なコンテンツを報告
Hello Ahmed,
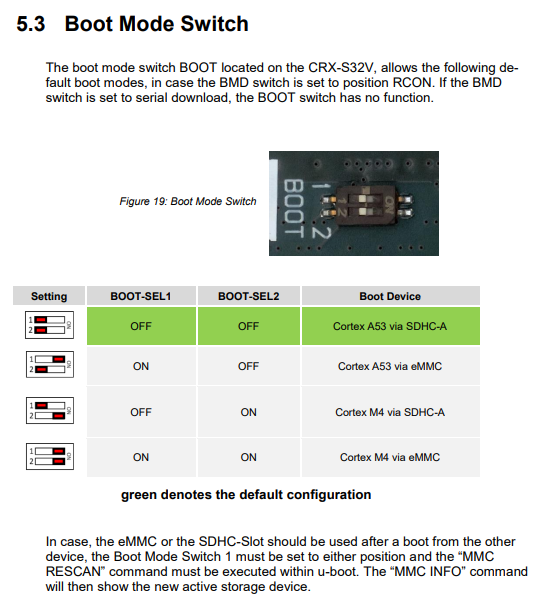
To change this, you need to adjust the Boot Mode Switch as follows:
This was taken from the SBC-S32V_User_Manual.pdf, which is found on the page:
S32V2 Vision and Sensor Fusion low-cost Evaluation Board | NXP Semiconductors
Best Regards,
Mike
- 新着としてマーク
- ブックマーク
- 購読
- ミュート
- RSS フィードを購読する
- ハイライト
- 印刷
- 不適切なコンテンツを報告
Hello Mike,
As always thank you very much for the information & the clarification. I hope this thread is useful for other people as well.
I switched the boot mode successfully from the SD card to booting from the eMMC, but unfortunately I'm still unable to debug the A53.
Even if I try to debug the example project "isp_sonyimx224_h264enc", which I was able to debug when booting from the SD card, now I can't debug it when booting from the eMMC.
If I try to debug a new empty project from the processor family "S32V2 Cortex-A53 Linux" while booting from the eMMC, I get the error message "Connection error has occurred during starting debug for launch 'new_cortex_a53_linux' . Error code is 102."
- 新着としてマーク
- ブックマーク
- 購読
- ミュート
- RSS フィードを購読する
- ハイライト
- 印刷
- 不適切なコンテンツを報告
Hello Ahmed,
Before trying to debug on the eMMC, were you able to confirm that you successfully programmed the eMMC with the Linux BSP (which you already managed to do with the SD card)?
If the board is successfully booting from the eMMC, then you should be able to connect via a terminal program and access the filesystem using the userid: root. There should be no password, unless you configured one.
It seems the debugger is unable to connect to the target, so it's likely some issue with the boot from the BSP.
Best Regards,
Mike
- 新着としてマーク
- ブックマーク
- 購読
- ミュート
- RSS フィードを購読する
- ハイライト
- 印刷
- 不適切なコンテンツを報告
Hello Mike,
Well I'm able to connect to the board via terminal, and S32 DS is able to download the application and run it. The problem comes when debugging.
The step of running "C/C++ Remote Application" goes without any problems, but when running the respective S32 Debugger Configuration the error arises.
Any suggestions where the problem might be?
- 新着としてマーク
- ブックマーク
- 購読
- ミュート
- RSS フィードを購読する
- ハイライト
- 印刷
- 不適切なコンテンツを報告
Hello Ahmed,
I suppose I am confused as to what you are trying to do. You indicated that the 'C/C++ Remote Application' works well. This is the debugger for the A53 core when you are running from Linux BSP.
You indicated the issue arises when you run the S32 Debugger operation.
1) Are you now trying to debug the A53 core using the S32 Debugger, while the Remote GDB debugger is already running on the A53?
2) Are you stopping the 'C/C++ Remote Application' debugging and then trying to start the S32 Debugger to debug the A53 core (which, as we already discussed, can only be done without booting from the Linux BSP)?
3) Are you trying to debug another core (ISP or APEX or M4 core) after the 'C/C++ Remote Application' debugger is running?
4) Are you starting the Remote GDB debugger, which seems to start OK, but later crashes before you can perform any debugging activities?
Best Regards,
Mike
- 新着としてマーク
- ブックマーク
- 購読
- ミュート
- RSS フィードを購読する
- ハイライト
- 印刷
- 不適切なコンテンツを報告
Hello Mike,
I tried 2 things:
1) To debug the A53 core using the S32 Debugger, while the Remote GDB debugger is already running on the A53. While the board is set to boot the Linux BSP from the eMMC. I tried to debug a new empty project, which I created from the folder 'Family S32V2' > 'S32V2 Cortex-A53 Linux'.
I think I understand now that this was a wrong experiment, because in the case of this setting I can only use the Remote GDB debugger, right?
The result is that the Remote GDB debugger works, but when I try to attach the respective S32 debugger I get the error message "Connection error has occurred during starting debug for launch 'cortex_a53_linux Debug'. Error code is 102."
2) To debug the A53 core using the S32 Debugger right away without without using the Remote GDB debugger. I set the board to boot from the SD card & removed the SD card, so that the Linux BSP isn't booted. I tried to debug a new empty project, which I created from the folder 'Family S32V2' > 'S32V234 Cortex-A53'.
The result is that I'm getting the error message "Connection error has occurred during starting debug for launch 's32v234_cortex_a53_A53_0_0_Debug_FLASH_S32Debug'. Error code is 102." or "Connection error has occurred during starting debug for launch 's32v234_cortex_a53_A53_0_0_Debug_RAM_S32Debug'. Error code is 102."
Also this is what I get from the USB connection when the board is set to boot from the SD card while the SD card is removed.
My target is to debug the Cortex A53 core using the S32 Debuge Probe. Can you please direct me to what is wrong or what should I do?
Best regards,
Ahmed
- 新着としてマーク
- ブックマーク
- 購読
- ミュート
- RSS フィードを購読する
- ハイライト
- 印刷
- 不適切なコンテンツを報告
Hello Ahmed,
Regarding #1, you are correct!
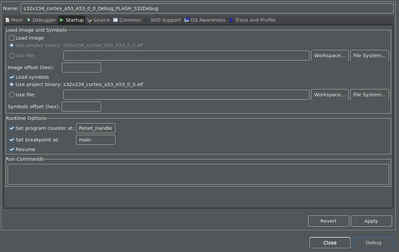
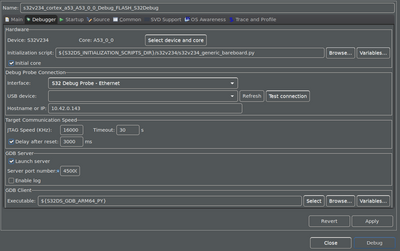
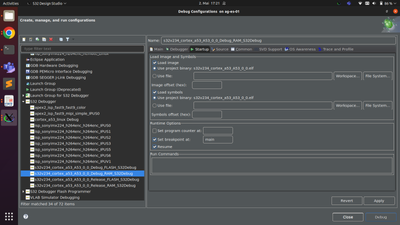
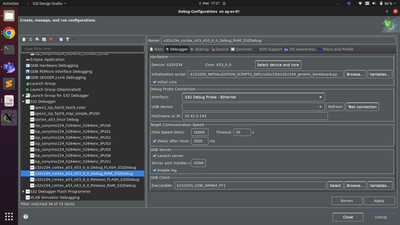
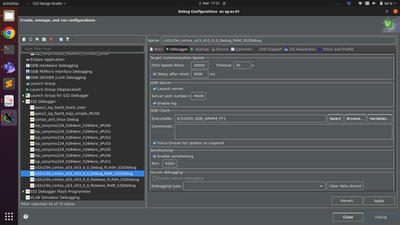
For #2, this should be working. Probably something is not setup correct. Could you please provide a screen capture of the Debugger and Startup tabs for the configuration 's32v234_cortex_a53_A53_0_0_Debug_FLASH_S32Debug'?
Also, in case you haven't already noticed, it is good to cycle the power to the S32 Debug Probe occasionally. Perhaps every time it has been idle for more than 30 minutes? I'm not sure of the duration, but it eventually goes into a state where it doesn't respond and needs to be reset. Probably isn't your issue here, but it's worth a try. I always cycle the power as a first check anytime I have a connection issue. Sometimes cycling the power to the EVB helps.
Best Regards,
Mike
- 新着としてマーク
- ブックマーク
- 購読
- ミュート
- RSS フィードを購読する
- ハイライト
- 印刷
- 不適切なコンテンツを報告
Hello Mike,
I just tried cycling the power of the board and the debug probe, but unfortunately I'm still getting the same error.
Here are the captures:
- 新着としてマーク
- ブックマーク
- 購読
- ミュート
- RSS フィードを購読する
- ハイライト
- 印刷
- 不適切なコンテンツを報告
Hi Ahmed,
I see a major issue right away. You didn't check the box for 'Load Image' on the Startup tab. If the debugger isn't loading the image, then there's nothing to debug on the target.
Best Regards,
Mike
- 新着としてマーク
- ブックマーク
- 購読
- ミュート
- RSS フィードを購読する
- ハイライト
- 印刷
- 不適切なコンテンツを報告
Hi Mike,
I checked the box for 'Load Image', but unfortunately I'm still getting the same error.
Best regards,
Ahmed
- 新着としてマーク
- ブックマーク
- 購読
- ミュート
- RSS フィードを購読する
- ハイライト
- 印刷
- 不適切なコンテンツを報告
Hi Ahmed,
I am trying to reproduce the issue on my end. I need to know your S32DS configuration so I can recreate the same setup on my side. Please go to S32DS Extensions and Updates menu, and select 'Installation Details'. Then send me the text from the resulting window.
Thanks,
Mike
- 新着としてマーク
- ブックマーク
- 購読
- ミュート
- RSS フィードを購読する
- ハイライト
- 印刷
- 不適切なコンテンツを報告
Hi Mike,
Thank you, I really appreciate your help.
Here's the text from the 'Installation Details':
Package: S32 Design Studio Platform Tools package; Version: 3.4.1; Build id: 202104231705
Package: Vision extension package for S32V23x; Version: 1.3.0; Build id: 202102122002
Package: AMMCLIB for S32V234 devices; Version: 1.1.25; Build id: 202106221205
Package: NXP GCC for Arm Embedded Processors Build 1574; Version: 1574; Build id: 202005201521
Package: NXP GCC for Arm Embedded Processors Build 1620; Version: 1620; Build id: 202005201521
Package: S32 Design Studio Platform package; Version: 3.4.1; Build id: 202104231705
Package: GDB Client for ARM Embedded Processors 9.2 Build 1701; Version: 1701; Build id: 202012011653
Package: S32V2xx development package; Version: 3.4.0; Build id: 202012171312
Best regards,
Ahmed
- 新着としてマーク
- ブックマーク
- 購読
- ミュート
- RSS フィードを購読する
- ハイライト
- 印刷
- 不適切なコンテンツを報告
Hello Ahmed,
I have investigated the issue. It seems I need to provide some clarification.
For the bareboard A53 project (no Linux support), the RAM build can be loaded by the debugger directly to the SRAM on the target and executed. The FLASH build must be programmed to FLASH memory using the '<project_name>_FLASHER_S32Debug' configuration under the 'S32 Debugger Flash Programmer' heading in the Debug Configurations menu. The process to use this is detailed in the S32DS user guide. Briefly, you must use the '<project_name>_FLASH_S32Debug_group' configuration under the 'Launch Group for S32 Debugger' heading in Debug Configurations menu to perform the flashing then start of the debug session. Both of the _FLASH_S32Debug and _FLASHER_S32Debug configurations must have the communication settings configured before using the launch group. I should note, the S32 Debugger Flash Programmer will only work for NOR Flash Memory devices which are connected to the target via the QuadSPI. I could be wrong, but I believe there is no such device installed on the SBC-S32V234 EVB.
However, this is only an answer to half of your issue. You had same error with the RAM build. I was not able to reproduce an issue with the RAM build of an empty project created in the same way as yours and with the same packages installed to S32DS 3.4.
The screen images you provided were for the FLASH build. Could you provide the same images for the RAM build debug configuration? Perhaps there is a clue.
In addition, make sure you check the box for 'Enable log' under the GDB Server settings on the Debugger tab. There is also another log, GDB Traces, which can be helpful. To enable this, go to Window -> Preferences, then in the navigation panel on the left, search for GDB, click on the GDB, then check the box on the right for 'Show the GDB traces consoles with character limit:'. Then look for the GDB traces view within the console panel after attempting to start the debug session. If you could send me the logs for both of these, there may be some clue there to what is occurring.
Best Regards,
Mike
- 新着としてマーク
- ブックマーク
- 購読
- ミュート
- RSS フィードを購読する
- ハイライト
- 印刷
- 不適切なコンテンツを報告
- 新着としてマーク
- ブックマーク
- 購読
- ミュート
- RSS フィードを購読する
- ハイライト
- 印刷
- 不適切なコンテンツを報告
Hi Ahmed,
I reviewed the log file you shared. I have a few questions:
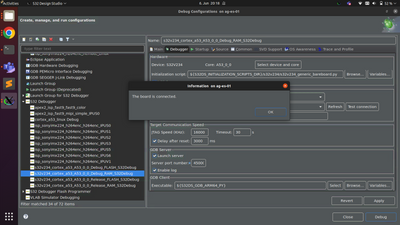
1) Could you try to use the 'Test Connection' button in the Debug Configurations menu and share the result?
2) Could you open CCS and try the following commands:
delete all
config cc s32dbg:10.42.0.143
show cc
ccs::config_chain testcore
jtag::lock
jtag::reset_tap 1
jtag::scan_in dr 256
(response after this line should be something like:
0x000000000000000000000000000000000000000000000000000000000830101D)
jtag::unlock
(you can locate CCS executable in installation directory, for windows it is C:\NXP\S32DS.3.4_2\S32DS\tools\S32Debugger\Debugger\Server\CCS\bin)
Launch this executable, then double click on it's icon from the system tray to open the console window. Then enter the above commands.
3) Did you make any HW changes (change switches, etc.) between the time it last work and now?
4) Did you install any newer packages and then later uninstall them (vs. what was listed in the Installation Details you provided previously)?
Best Regards,
Mike
- 新着としてマーク
- ブックマーク
- 購読
- ミュート
- RSS フィードを購読する
- ハイライト
- 印刷
- 不適切なコンテンツを報告
Hi Mike,
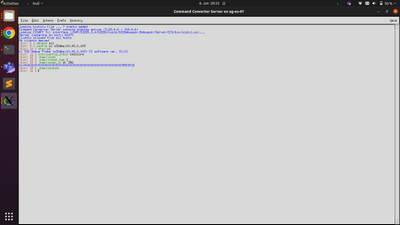
You can find attached to this reply a couple of screenshots answering questions 1 & 2.
3) I only changed the setting of the boot switches to be BOOT-SEL1 ON & BOOT-SEL2 OFF, this configuration means that the board will boot via the eMMC.
4) No, I currently have the packages that were listed in the details I provided you.
Best regards,
Ahmed
