- Forums
- Product Forums
- General Purpose MicrocontrollersGeneral Purpose Microcontrollers
- i.MX Forumsi.MX Forums
- QorIQ Processing PlatformsQorIQ Processing Platforms
- Identification and SecurityIdentification and Security
- Power ManagementPower Management
- Wireless ConnectivityWireless Connectivity
- RFID / NFCRFID / NFC
- Advanced AnalogAdvanced Analog
- MCX Microcontrollers
- S32G
- S32K
- S32V
- MPC5xxx
- Other NXP Products
- S12 / MagniV Microcontrollers
- Powertrain and Electrification Analog Drivers
- Sensors
- Vybrid Processors
- Digital Signal Controllers
- 8-bit Microcontrollers
- ColdFire/68K Microcontrollers and Processors
- PowerQUICC Processors
- OSBDM and TBDML
- S32M
- S32Z/E
-
- Solution Forums
- Software Forums
- MCUXpresso Software and ToolsMCUXpresso Software and Tools
- CodeWarriorCodeWarrior
- MQX Software SolutionsMQX Software Solutions
- Model-Based Design Toolbox (MBDT)Model-Based Design Toolbox (MBDT)
- FreeMASTER
- eIQ Machine Learning Software
- Embedded Software and Tools Clinic
- S32 SDK
- S32 Design Studio
- GUI Guider
- Zephyr Project
- Voice Technology
- Application Software Packs
- Secure Provisioning SDK (SPSDK)
- Processor Expert Software
- Generative AI & LLMs
-
- Topics
- Mobile Robotics - Drones and RoversMobile Robotics - Drones and Rovers
- NXP Training ContentNXP Training Content
- University ProgramsUniversity Programs
- Rapid IoT
- NXP Designs
- SafeAssure-Community
- OSS Security & Maintenance
- Using Our Community
-
- Cloud Lab Forums
-
- Knowledge Bases
- ARM Microcontrollers
- i.MX Processors
- Identification and Security
- Model-Based Design Toolbox (MBDT)
- QorIQ Processing Platforms
- S32 Automotive Processing Platform
- Wireless Connectivity
- CodeWarrior
- MCUXpresso Suite of Software and Tools
- MQX Software Solutions
- RFID / NFC
- Advanced Analog
-
- NXP Tech Blogs
- Home
- :
- Software Forums
- :
- S32 Design Studio Knowledge Base
- :
- Troubleshooting: PEmicro Debug Connection: Target Communication Speed
Troubleshooting: PEmicro Debug Connection: Target Communication Speed
- Subscribe to RSS Feed
- Mark as New
- Mark as Read
- Bookmark
- Subscribe
- Printer Friendly Page
- Report Inappropriate Content
Troubleshooting: PEmicro Debug Connection: Target Communication Speed
Troubleshooting: PEmicro Debug Connection: Target Communication Speed
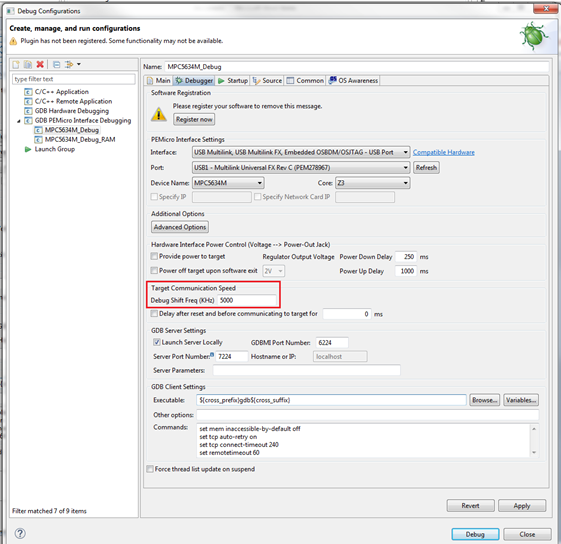
PEmicro’s debug configuration allows user to modify JTAG communication shift frequency between debug interface and the target. By default, this frequency is set to a maximum value of 5000KHz, to take advantage of the fastest run control and FLASH programming experience:
At the same time, not every PowerPC processor might be able to support highest debug shift frequencies with all PEmicro debug interfaces. For example, debug frequency for MPC5634M board used in conjunction with Multilink Universal FX RevC , needs to be lowered to 4000Khz in order to succeed. Hence, if debug session fails to successfully start up or fails on FLASH programming, lowering a debug shift frequency by a factor of 2 or 4 is the first trouble shooting recommendation.
To get to PEmicro’s debug configuration window, one should select “Debug Configuration” from the menu next to a debug icon, and switch over to the Debug tab, within “Debug Configuration” menu pop- up.
- Mark as Read
- Mark as New
- Bookmark
- Permalink
- Report Inappropriate Content
Hello,
thanks a lot for this useful tip.
I tried to lower the speed because I face many unstability when debugging on a multicore project (MPC5748G - Multilink FX). But it seems I cannot modify the setting for other core than Z4_0. The textbox is greyed.
I can only modify Z4_0.
I thought maybe the other cores would apply same configuration as Z4_0 by default but not.
Could you tell me what I'm doing wrong ?
Thanks a lot
Best regards,
- Mark as Read
- Mark as New
- Bookmark
- Permalink
- Report Inappropriate Content
Hello,
In a multi-core device project, the PEmicro debug configurations needs to be done via the main core debug configuration dialog. In a multi-core device setup, the main core is also used to program all object files into main and secondary cores as well (please see chapter 7 in attached PE_GDB_Server_Plugin_E200_User_Guide_v1.03.pdf for more details).
At the same time the secondary core debugging is being done in "Attach" mode, once the debug communication and all object files have already been loaded. Hence, the actual debug configuration settings for secondary cores are disabled, since they rely on the settings that were used to establish communication via the primary debug core.
I hope it helps.
Mike
- Mark as Read
- Mark as New
- Bookmark
- Permalink
- Report Inappropriate Content
Hello,
thanks a lot for your answer. It is clearer now !
Best regards,


