- Forums
- Product Forums
- General Purpose MicrocontrollersGeneral Purpose Microcontrollers
- i.MX Forumsi.MX Forums
- QorIQ Processing PlatformsQorIQ Processing Platforms
- Identification and SecurityIdentification and Security
- Power ManagementPower Management
- Wireless ConnectivityWireless Connectivity
- RFID / NFCRFID / NFC
- Advanced AnalogAdvanced Analog
- MCX Microcontrollers
- S32G
- S32K
- S32V
- MPC5xxx
- Other NXP Products
- S12 / MagniV Microcontrollers
- Powertrain and Electrification Analog Drivers
- Sensors
- Vybrid Processors
- Digital Signal Controllers
- 8-bit Microcontrollers
- ColdFire/68K Microcontrollers and Processors
- PowerQUICC Processors
- OSBDM and TBDML
- S32M
- S32Z/E
-
- Solution Forums
- Software Forums
- MCUXpresso Software and ToolsMCUXpresso Software and Tools
- CodeWarriorCodeWarrior
- MQX Software SolutionsMQX Software Solutions
- Model-Based Design Toolbox (MBDT)Model-Based Design Toolbox (MBDT)
- FreeMASTER
- eIQ Machine Learning Software
- Embedded Software and Tools Clinic
- S32 SDK
- S32 Design Studio
- GUI Guider
- Zephyr Project
- Voice Technology
- Application Software Packs
- Secure Provisioning SDK (SPSDK)
- Processor Expert Software
- Generative AI & LLMs
-
- Topics
- Mobile Robotics - Drones and RoversMobile Robotics - Drones and Rovers
- NXP Training ContentNXP Training Content
- University ProgramsUniversity Programs
- Rapid IoT
- NXP Designs
- SafeAssure-Community
- OSS Security & Maintenance
- Using Our Community
-
- Cloud Lab Forums
-
- Knowledge Bases
- ARM Microcontrollers
- i.MX Processors
- Identification and Security
- Model-Based Design Toolbox (MBDT)
- QorIQ Processing Platforms
- S32 Automotive Processing Platform
- Wireless Connectivity
- CodeWarrior
- MCUXpresso Suite of Software and Tools
- MQX Software Solutions
- RFID / NFC
- Advanced Analog
-
- NXP Tech Blogs
- Home
- :
- Software Forums
- :
- S32 Design Studio Knowledge Base
- :
- Single Wire Output (SWO) support within S32 Design Studio, enabled by PEmicro's GDB Server
Single Wire Output (SWO) support within S32 Design Studio, enabled by PEmicro's GDB Server
- Subscribe to RSS Feed
- Mark as New
- Mark as Read
- Bookmark
- Subscribe
- Printer Friendly Page
- Report Inappropriate Content
Single Wire Output (SWO) support within S32 Design Studio, enabled by PEmicro's GDB Server
Single Wire Output (SWO) support within S32 Design Studio, enabled by PEmicro's GDB Server
PEmicro’s GDB Server can take advantage of four useful SWO debug tools:
- Power Measurement
- SWO ITM Console
- SWO Data capture
- Real-Time Expressions.
This document describes how to enable and use these features.
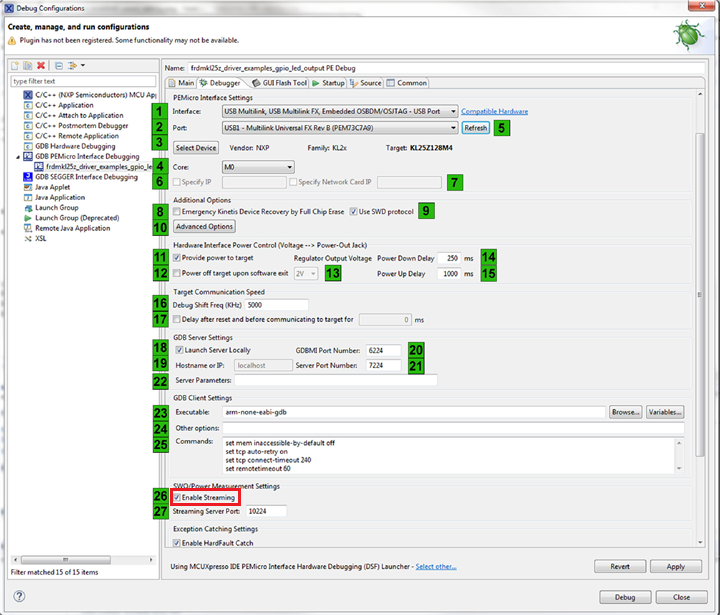
Note: To set up streaming for SWO debug features, the user should check the “Enable Streaming” checkbox in Debug Configurations during setup. Then the port should be specified in the Streaming Server Port text box.
Hardware Requirements
The following versions (or later) of PEmicro hardware interfaces are required to take advantage of SWO streaming functionality:
- Multilink FX Rev. C
- Multilink Universal Rev. D
- Multilink ACMP Rev. B
Real-Time Power Measurement
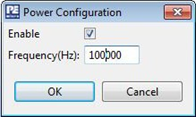
To enable Power Measurement capture, an active debug session must already be in process. Click the Gear Icon on the title bar of the PEmicro "Power Measurement” window. Select the frequency of data capture and check the Enable box. After clicking OK, Power Recording is now active.
Note: The Multilink FX debug probe is required for Real-Time Power Measurement
Power Configuration Dialog
The next time the target MCU is run, real-time power measurement readings will be shown.
The user can start/stop power recording, zoom, export data, and more
SWO Printf Console
The SWO Printf Console will display messages which are streamed through the SWO pin and captured by the Multilink. There are two main configuration steps needed to leverage this feature. First, the project must be configured to re-direct the printf() statements to the SWO Printf peripheral. This is done at project creation time.
Second, the green "Play" button on the SWO ITM Console needs to be clicked during an active debug session. This will cause data collection of SWO printf information to occur on the next Resume. Once data is streaming, the red “Stop” button will stop data streaming.
Printf() Statements Displayed In SWO ITM Console
The Multilink automatically measures the data communication rate on the SWO pin and adjusts to it automatically. This auto-detect sequence is done each time the processor is stopped in debug mode. If the running code changes the core frequency, a breakpoint should be set after the frequency change so the Multilink can adjust to the new SWO communications rate (which is a function of the core frequency).
SWO Data capture
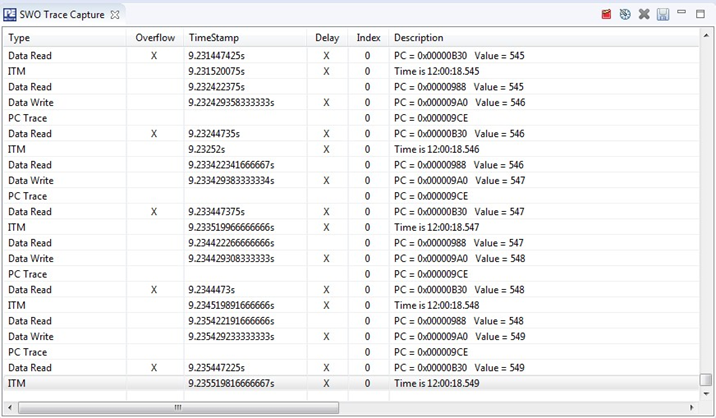
The SWO Data view allows the user to configure variables to be tracked such that any reads and writes to these variables are captured and streamed to the Multilink via the SWO pin. This view shows all of the realtime access which have occurred along with the timing of the different accesses.
For SWO data, there is a bit more setup. The user needs to select the 'Eyeglasses+' symbol which will bring up a popup of Add datawatch items. Simply enter the information of the different variables to be tracked. Up to four separate variables can be tracked simultaneously. In this example, we select that we wish to capture read and writes of the ledsOn and seconds variables. Once added, the user needs to select which watches data will be captured by checking the "Enable trace" boxes in the SWO Data window and then click the Green Arrow to set the program to start capture on Resume.Upon resuming the application, the right side of the window will show the access which are occurring. Note that this happens in real-time; the microcontroller is not stopped when accesses occur (i.e. the is separate from data breakpoints).
Variable Read/Writes Displayed In Real Time
The Multilink automatically measures the data communication rate on the SWO pin and adjusts to it automatically. This auto-detect sequence is done each time the processor is stopped in debug mode. If the running code changes the core frequency, a breakpoint should be set after the frequency change so the Multilink can adjust to the new SWO communications rate (which is a function of the core frequency).
Real-Time Expressions
This view is similar to the standard Eclipse "Expressions" window with the exception that its contents will update in real-time without the device being halted in debug mode. Just add the appropriate variables to the Real Time Expressions window and you will see them updating in real-time.
Add Variables To Real-Time Expressions Windows


