- Forums
- Product Forums
- General Purpose MicrocontrollersGeneral Purpose Microcontrollers
- i.MX Forumsi.MX Forums
- QorIQ Processing PlatformsQorIQ Processing Platforms
- Identification and SecurityIdentification and Security
- Power ManagementPower Management
- Wireless ConnectivityWireless Connectivity
- RFID / NFCRFID / NFC
- Advanced AnalogAdvanced Analog
- MCX Microcontrollers
- S32G
- S32K
- S32V
- MPC5xxx
- Other NXP Products
- S12 / MagniV Microcontrollers
- Powertrain and Electrification Analog Drivers
- Sensors
- Vybrid Processors
- Digital Signal Controllers
- 8-bit Microcontrollers
- ColdFire/68K Microcontrollers and Processors
- PowerQUICC Processors
- OSBDM and TBDML
- S32M
- S32Z/E
-
- Solution Forums
- Software Forums
- MCUXpresso Software and ToolsMCUXpresso Software and Tools
- CodeWarriorCodeWarrior
- MQX Software SolutionsMQX Software Solutions
- Model-Based Design Toolbox (MBDT)Model-Based Design Toolbox (MBDT)
- FreeMASTER
- eIQ Machine Learning Software
- Embedded Software and Tools Clinic
- S32 SDK
- S32 Design Studio
- GUI Guider
- Zephyr Project
- Voice Technology
- Application Software Packs
- Secure Provisioning SDK (SPSDK)
- Processor Expert Software
- Generative AI & LLMs
-
- Topics
- Mobile Robotics - Drones and RoversMobile Robotics - Drones and Rovers
- NXP Training ContentNXP Training Content
- University ProgramsUniversity Programs
- Rapid IoT
- NXP Designs
- SafeAssure-Community
- OSS Security & Maintenance
- Using Our Community
-
- Cloud Lab Forums
-
- Knowledge Bases
- ARM Microcontrollers
- i.MX Processors
- Identification and Security
- Model-Based Design Toolbox (MBDT)
- QorIQ Processing Platforms
- S32 Automotive Processing Platform
- Wireless Connectivity
- CodeWarrior
- MCUXpresso Suite of Software and Tools
- MQX Software Solutions
- RFID / NFC
- Advanced Analog
-
- NXP Tech Blogs
- Home
- :
- 软件论坛
- :
- S32 Design Studio知识库
- :
- S32DS Quick Start Guide
S32DS Quick Start Guide
S32DS Quick Start Guide
S32DS Quick Start Guide
The Quick Start describes how to use the S32 Design Studio to create, build, and debug a project.
Starting S32DS Design Studio for S32 Platform 3.5
To start S32 Design Studio and begin to work with it:
- Launch S32 Design Studio : locate the shortcut depending on your selection during the installation, and double-click the product icon.
The Eclipse Launcher dialog box appears to let you define the location of your workspace.

Note: A workspace is the folder where S32 Design Studio stores projects that you create or import.
- Select a folder for your workspace. It is recommended to create a new workspace for each product instance.
- To choose the default location, click OK.
- To use a different location, click Browse. In the Select Workspace Directory dialog box, select the preferred folder or click Make New Folder to create a new folder for storing your projects. Click OK.
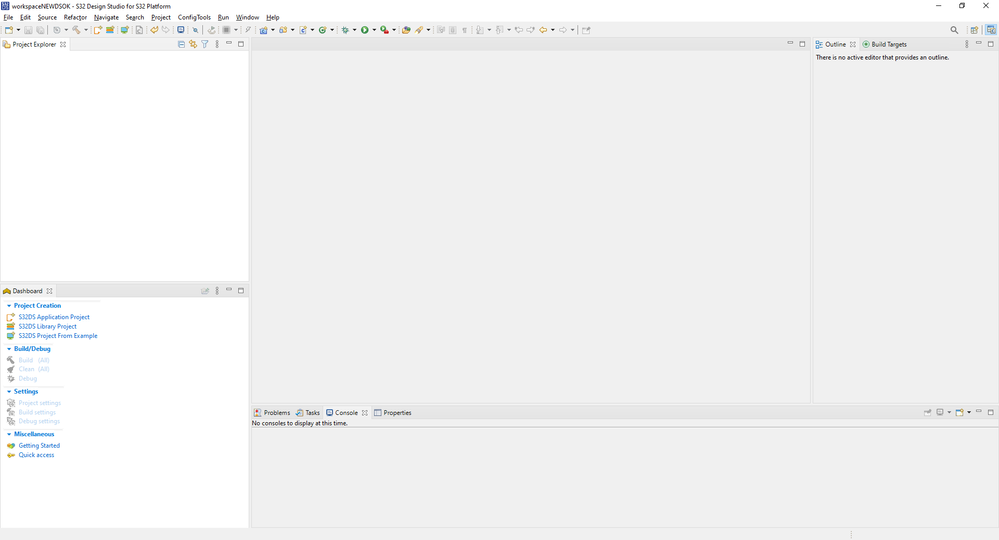
- S32 Design Studio is launched. Browse through the Getting Started tab and close it. The workbench appears:

Creating and building a project
To create and build a project:
- Click File > New > S32DS Application Project or S32DS Library Project on the menu bar. The first page of the wizard appears.
- Specify the name of the new project in the Project name text box.
Note: The Location field shows the default project location. If you want to change this location, clear the Use default location check box, click Browse and specify a different location. Click OK.
- Select the target processor from the Processors panel.
- Click Next. The second page of the wizard appears.
- Check the project settings, select the cores and parameters. Click Finish.
The new project appears in the Project Explorer view.Note: The wizard creates one or multiple projects, depending on the number of selected cores.
- To build your project, do any of the following:
- Right-click the project in the Project Explorer view and click Build Project
- Select the project in the Project Explorer view, then click Project > Build Project on the menu
- Select the project in the Project Explorer view and click on the tool icon on the toolbar.
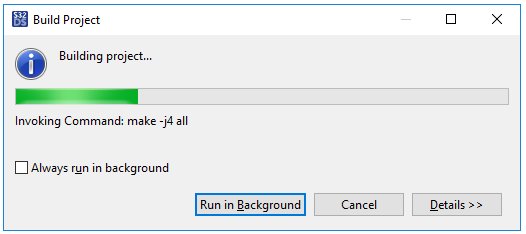
The build process starts.

If a build generates any errors or warnings, you can see them in the Problems view. Read through the build messages in the Console view to make sure that the project is built successfully.
Debugging a project
To debug a project:
- Set the debug configuration for your project.
- Select the project in the Project Explorer view.
- Open the debug configuration in any of these ways:
- Right-click the project and select Debug as > Debug Configurations… from the context menu.
- Choose Run > Debug Configurations… from the menu bar.
- Click an arrow next to Debug picture on the toolbar and select DebugConfigurations….
- In the Debug Configurations dialog box, select the required debug configuration. The name of the debug configuration is composed of the project name, debugging interface and build configuration. The configuration settings appear on the tabs.
- Modify the configuration settings where required and click Apply to save the changes.
- Click Debug. The debugger downloads the program to the memory of the target processor. The Debug perspective is displayed. The execution halts at the first statement of the main() function. The program counter icon on the marker bar points the next statement to be executed.

- To set and run to a breakpoint:
- Double-click on the marker bar next to a statement. The breakpoint indicator (blue dot) appears next to the statement.
- From the Debug view, select Run > Resume on the menu bar. The debugger executes all statements up to (but not including) the breakpoint statement.
- To control the program:
- From the Debug view, select Run > Step Over from the menu bar. The debugger executes the breakpoint statement and halts at the next statement.
- From the Debug view, select Run > Resume from the menu bar. The debugger resumes the program execution.
- From the Debug view, select Run > Terminate. The debug session ends.
0% 有帮助
(0/1)

