- Forums
- Product Forums
- General Purpose MicrocontrollersGeneral Purpose Microcontrollers
- i.MX Forumsi.MX Forums
- QorIQ Processing PlatformsQorIQ Processing Platforms
- Identification and SecurityIdentification and Security
- Power ManagementPower Management
- Wireless ConnectivityWireless Connectivity
- RFID / NFCRFID / NFC
- Advanced AnalogAdvanced Analog
- MCX Microcontrollers
- S32G
- S32K
- S32V
- MPC5xxx
- Other NXP Products
- S12 / MagniV Microcontrollers
- Powertrain and Electrification Analog Drivers
- Sensors
- Vybrid Processors
- Digital Signal Controllers
- 8-bit Microcontrollers
- ColdFire/68K Microcontrollers and Processors
- PowerQUICC Processors
- OSBDM and TBDML
- S32M
- S32Z/E
-
- Solution Forums
- Software Forums
- MCUXpresso Software and ToolsMCUXpresso Software and Tools
- CodeWarriorCodeWarrior
- MQX Software SolutionsMQX Software Solutions
- Model-Based Design Toolbox (MBDT)Model-Based Design Toolbox (MBDT)
- FreeMASTER
- eIQ Machine Learning Software
- Embedded Software and Tools Clinic
- S32 SDK
- S32 Design Studio
- GUI Guider
- Zephyr Project
- Voice Technology
- Application Software Packs
- Secure Provisioning SDK (SPSDK)
- Processor Expert Software
- Generative AI & LLMs
-
- Topics
- Mobile Robotics - Drones and RoversMobile Robotics - Drones and Rovers
- NXP Training ContentNXP Training Content
- University ProgramsUniversity Programs
- Rapid IoT
- NXP Designs
- SafeAssure-Community
- OSS Security & Maintenance
- Using Our Community
-
- Cloud Lab Forums
-
- Knowledge Bases
- ARM Microcontrollers
- i.MX Processors
- Identification and Security
- Model-Based Design Toolbox (MBDT)
- QorIQ Processing Platforms
- S32 Automotive Processing Platform
- Wireless Connectivity
- CodeWarrior
- MCUXpresso Suite of Software and Tools
- MQX Software Solutions
- RFID / NFC
- Advanced Analog
-
- NXP Tech Blogs
- Home
- :
- ソフトウェア・フォーラム
- :
- S32 デザインスタジオ・ナレッジベース
- :
- HOWTO: Use DDR Configuration and Validation Tool (S32DS for Vision)
HOWTO: Use DDR Configuration and Validation Tool (S32DS for Vision)
- RSS フィードを購読する
- 新着としてマーク
- 既読としてマーク
- ブックマーク
- 購読
- 印刷用ページ
- 不適切なコンテンツを報告
HOWTO: Use DDR Configuration and Validation Tool (S32DS for Vision)
HOWTO: Use DDR Configuration and Validation Tool (S32DS for Vision)
There are three methods to run the configuration tool; from S32DS, from Terminal and JTAG, and from command line.
S32DS Method
1) Make sure EVB is powered and connected to PC via PEMicro (Universal Multilink) or Lauterbach
2) Launch S32DS for Vision
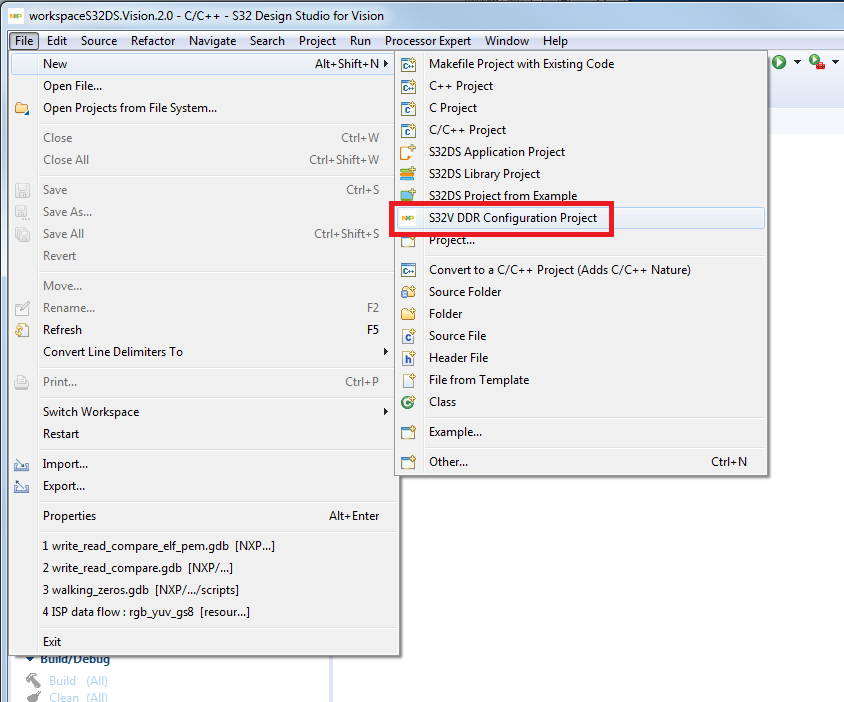
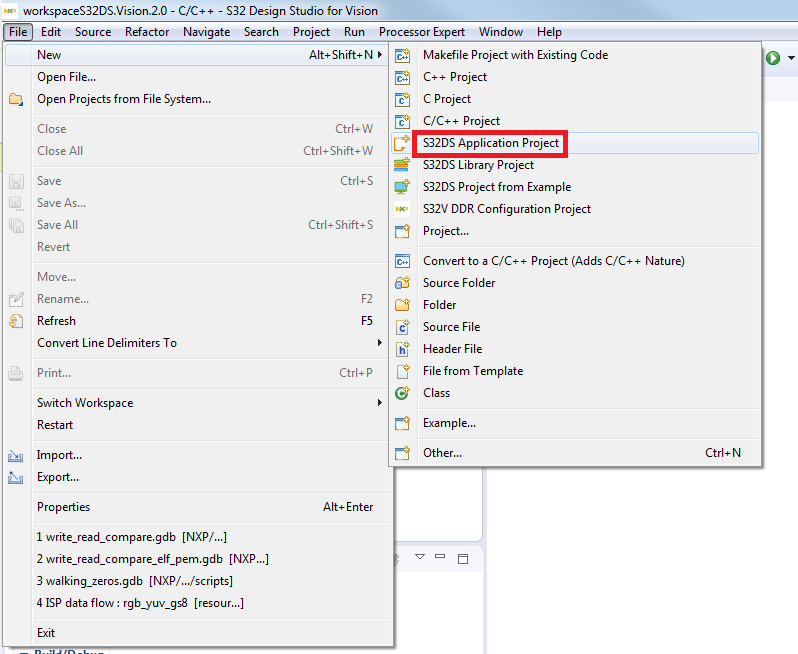
3) File -> New -> S32V DDR Configuration Project
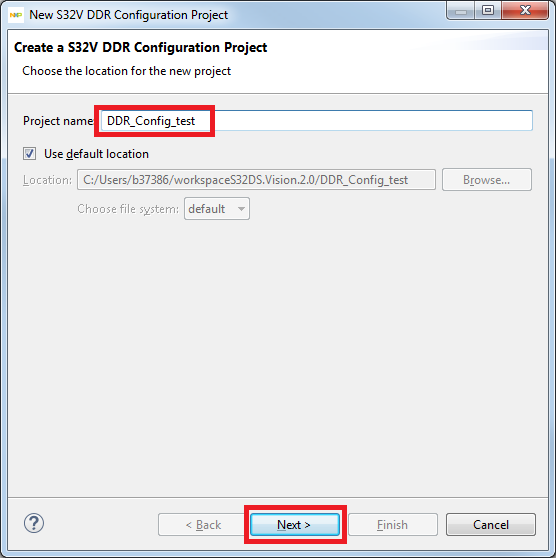
4) Enter a name for the project, for example 'DDR_Config_test'. Click Next
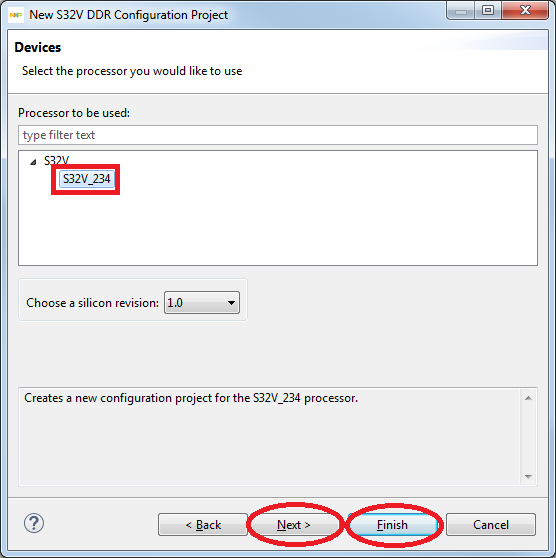
5) Expand 'S32V' and select 'S32V_234'
6) Click Finish to generate the project with default settings OR if you wish, to view or adjust more project settings, click Next. For this demonstration, we click Next.
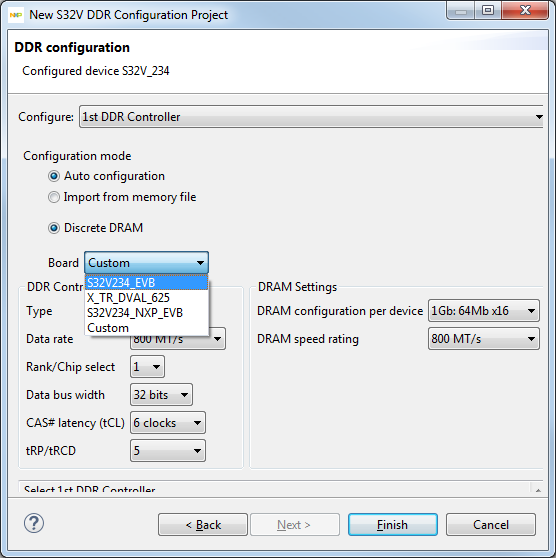
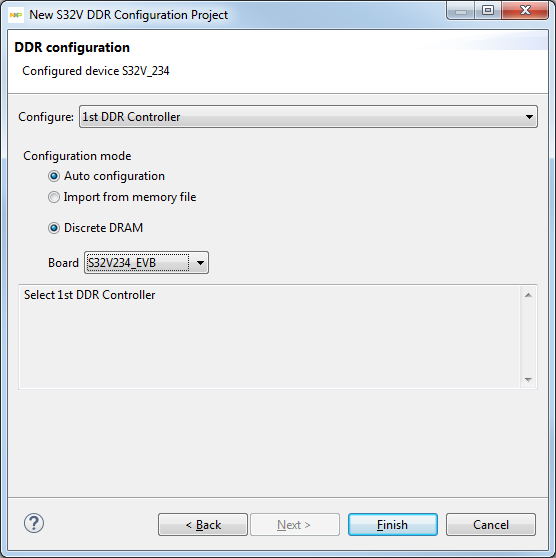
a. Select which DDR controller to which the settings will be applied. For this demonstration, we leave it at default (1st DDR Controller)
b. There is an option to import settings from a file
c. Board setting allows you to select from a list of predefined configurations, one for each of the NXP S32V234 evaluation boards
i. S32V234_EVB is for LPDDR2 (SCH28899 and SCH28292(old board))
ii. X_TR_DVAL_625 is for DDR3 (SCH28662(old board))
iii. S32V234_NXP_EVB is for SCH29288 (S32V234-EVB2)
iv. Custom allows for more options to be selected. See user manual for more detail
d. For this demonstration, we select S32V234_EVB
e. Click Finish
7) It will take a couple minutes to generate the project. You will get a prompt to pen the S32V DDR Configuration perspective. Click Yes.
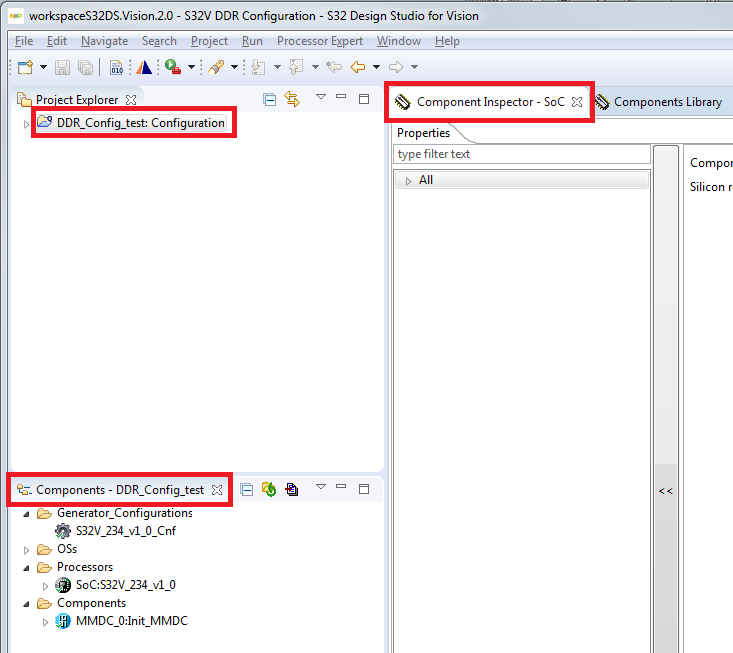
8) Now the project is generated and you can see it listed in the Project Explorer
9) Notice the Components and Component Inspector views of the S32V DDR Configuration perspective.
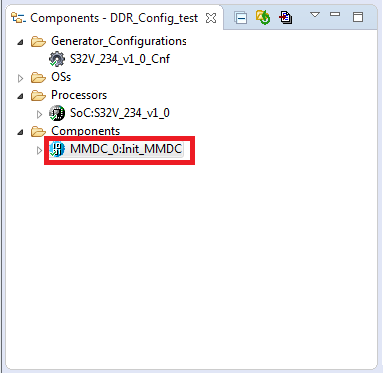
10) Select the component 'MMDC_0:Init_MMDC from the Components view
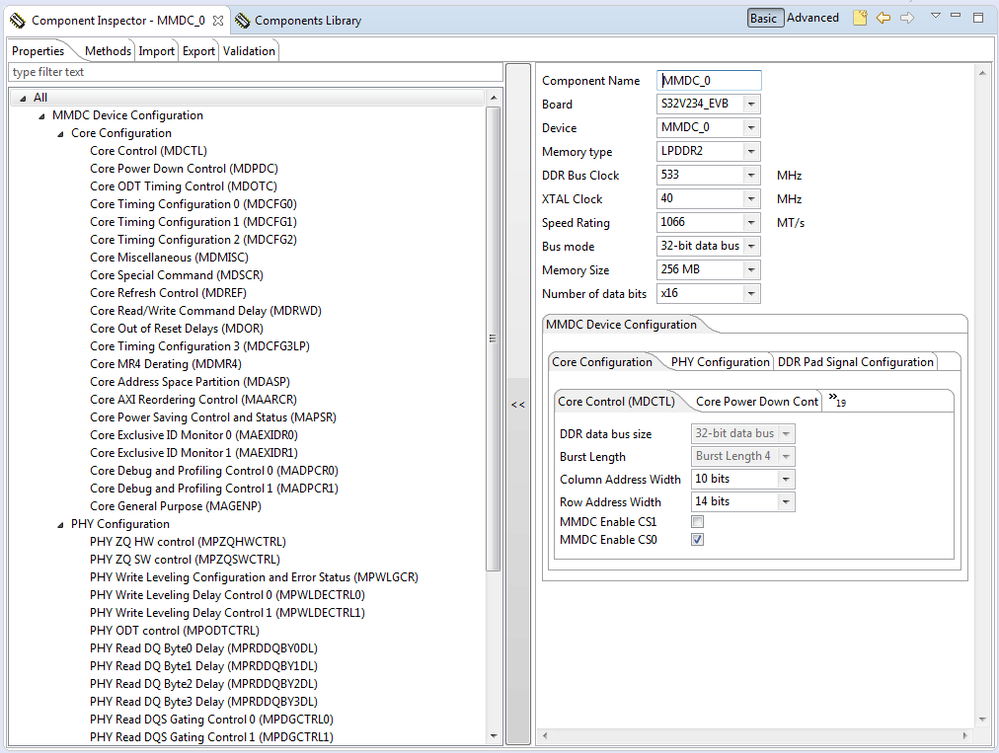
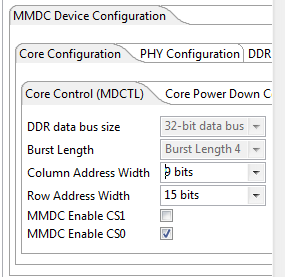
11) In the Component Inspector window you can see all of the configuration settings. You can modify the settings here. Changes made to some of the high-level settings may also cause changes to some of the low-level settings. There are some consistency checks that are run automatically after settings are changed which will trigger an error message in the case of an invalid configuration.
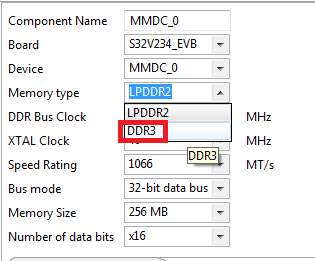
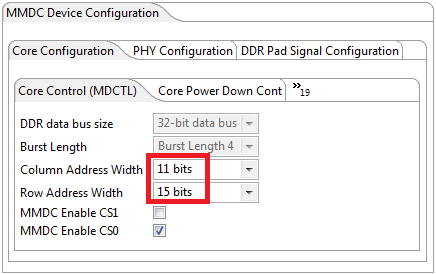
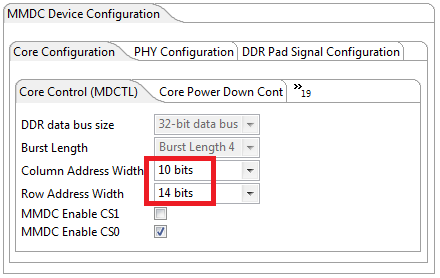
a. For an example of high-level settings affecting low-level settings, try changing the 'Memory type' from LPDDR2 to DDR3. You can see the Burst Length, Column Address Width, and Row Address Width have changed.
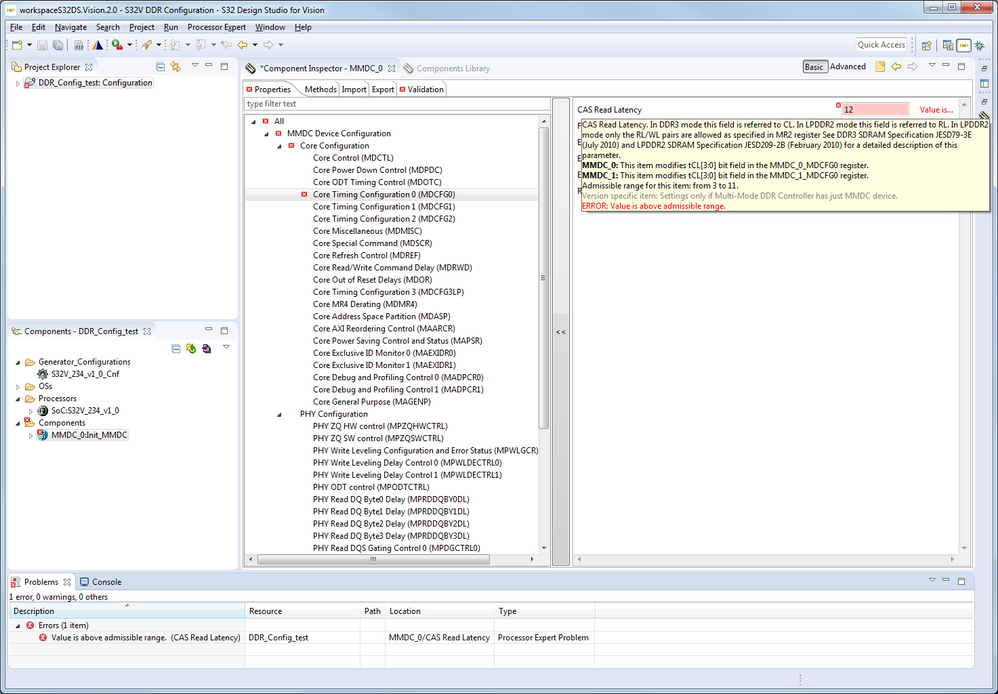
b. For an example of a consistency check on an invalid configuration, try changing the CAS Read Latency value (MDCFG0) from 8 to 12 (valid range as displayed with mouse hover tooltip shows 3-11), you will see the error appear. Change back to 8 and error is gone.
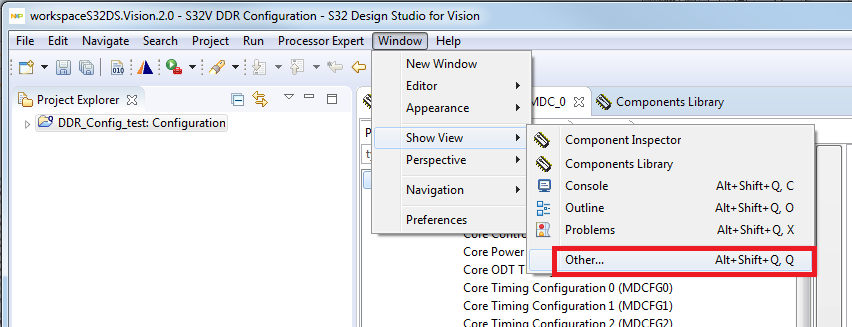
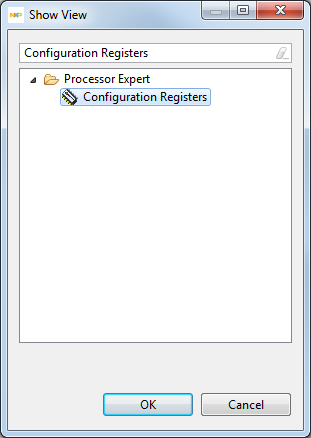
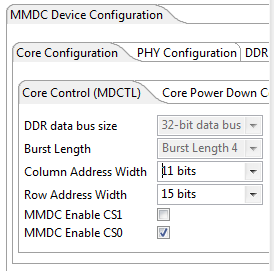
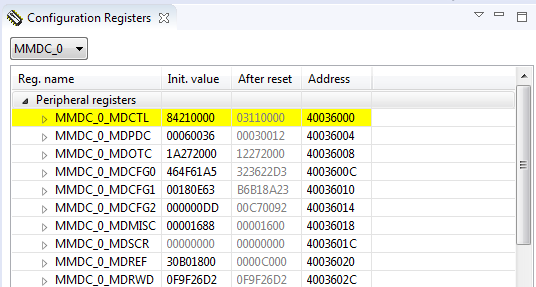
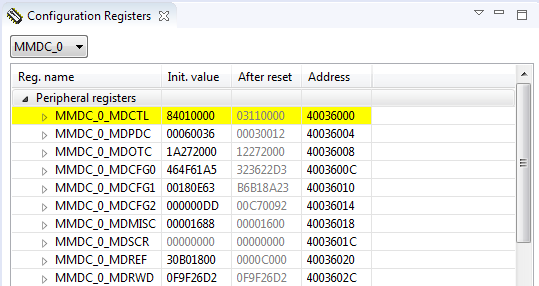
12) Open Configuration Registers view. Window -> Show View -> Other -> Processor Expert -> Configuration Registers. This shows how the settings will appear in the memory map. As you change the settings, the values will update here and the affected rows will be highlighted. Try it by changing Column Address Width in MDCTL of the Component Selector window. Likewise, you can try changing the value manually in the Configuration Registers view and see the setting in the Component Selector window update as well.
*Hint: enter the name of the view in the search bar to find it quicker
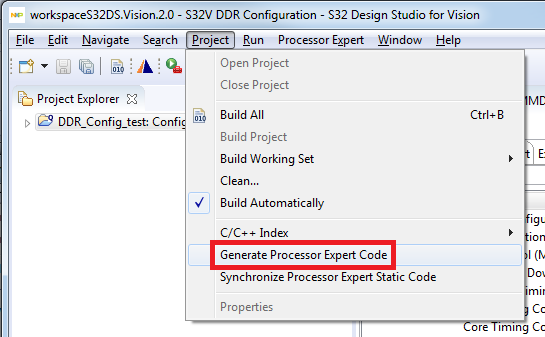
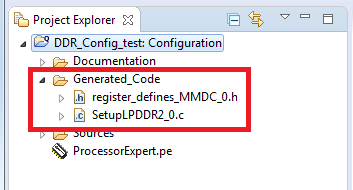
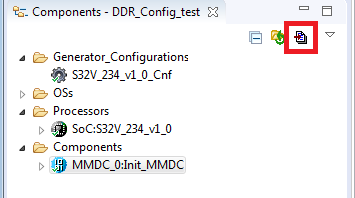
13) Once all changes to the settings are complete, code can be generated. Press the 'Generate Processor Expert Code' button in the Components view. The generated .c and .h file will appear in the 'Generated_Code' folder of the Configuration project. These can be copied into your application project.
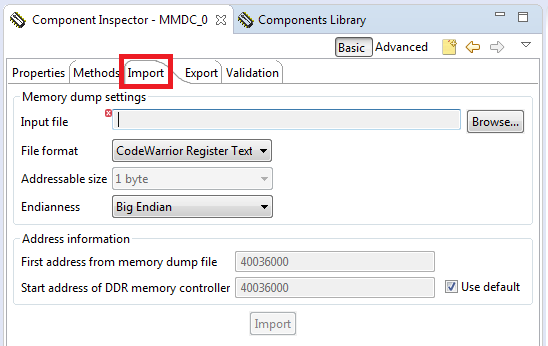
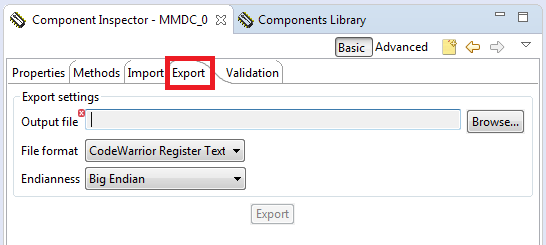
14) Back in the Component Inspector view, there are tabs for Import and Export settings. The Import settings tab will allow you to import existing settings files, as was also shown in the new project wizard. From the Export settings tab, you can generate a settings file for storage or sharing. The settings files for MMDC_0 and MMDC_1 for each of the supported NXP EVBs are included and can be located in 'C:\NXP\S32DS_Vision_v2.0\eclipse\ProcessorExpert\Optimization\resources\S32V\Boards' and then select the folder for the specific board.
The CodeWarrior Register Text format is recommended for these files.
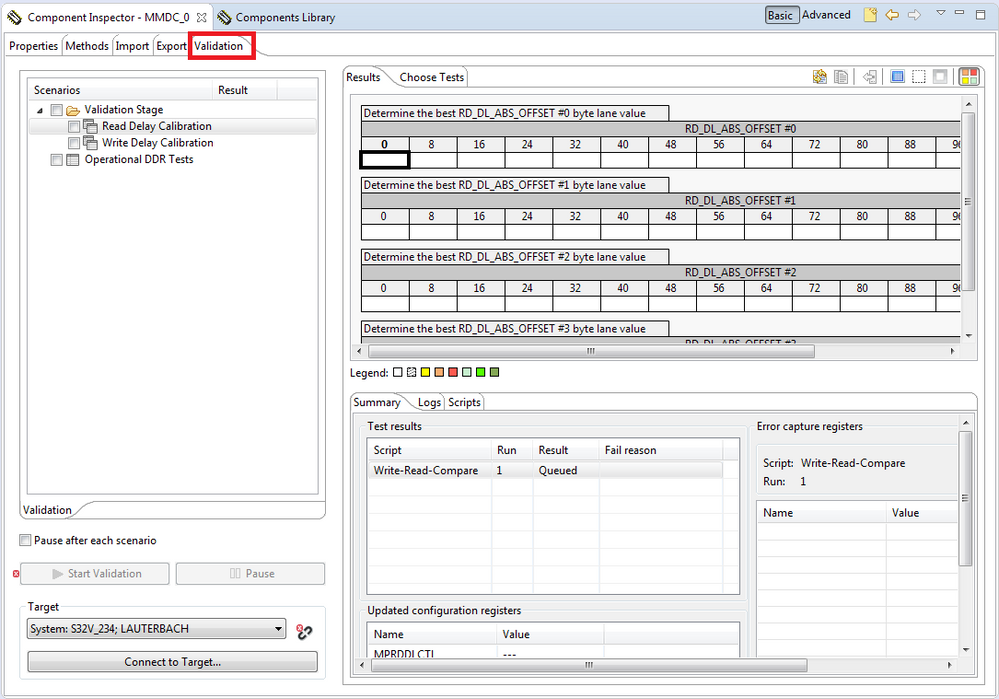
15) Now select the 'Validation' tab (some views, such as Configuration Registers, can be minimized for better view). Here we can execute a validation of the configuration settings we've made. Now is a good time to double check the hardware connections.
16) Select the connection method (either PEMicro or Lauterbach, depending on your setup). We will use System: S32V234; PEMICRO
17) Press 'Connect to Target'
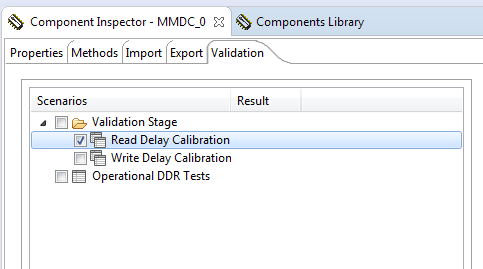
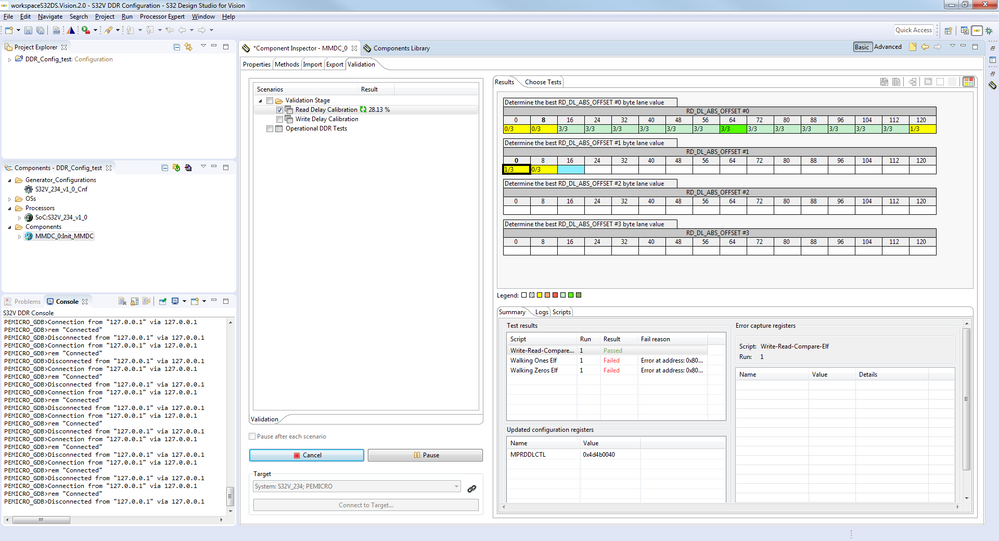
18) Check a box for one of the scenarios. For example, select 'Read Delay Calibration'
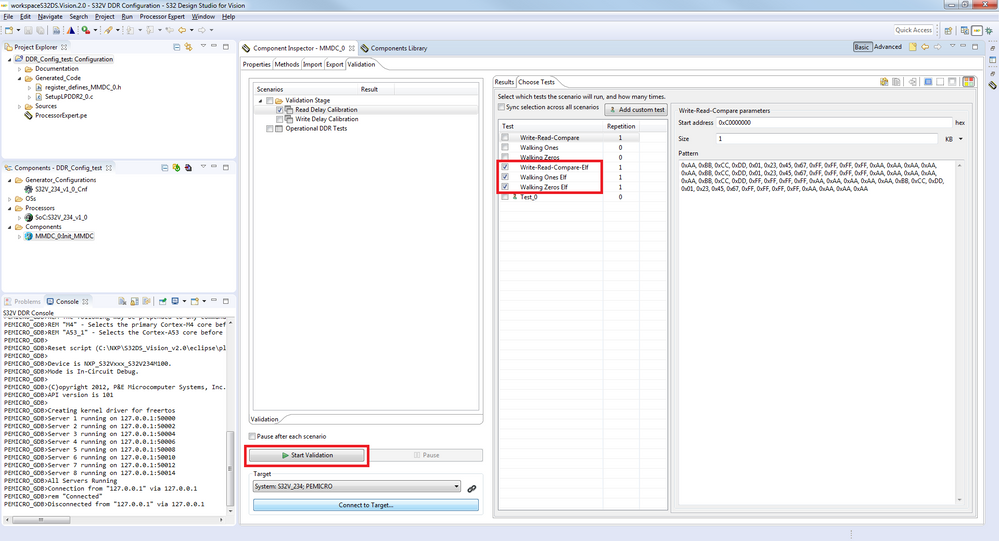
19) Select the 'Choose Tests' tab
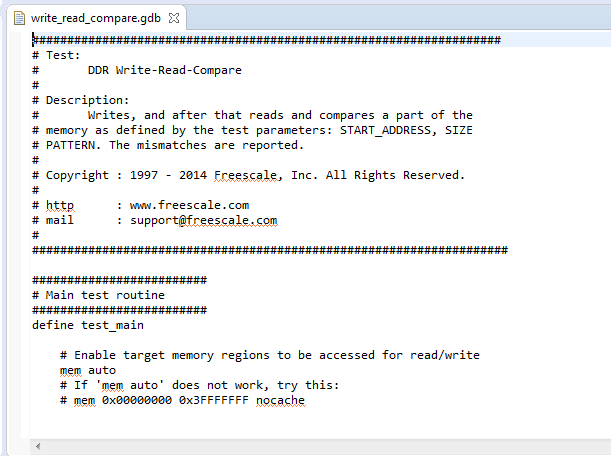
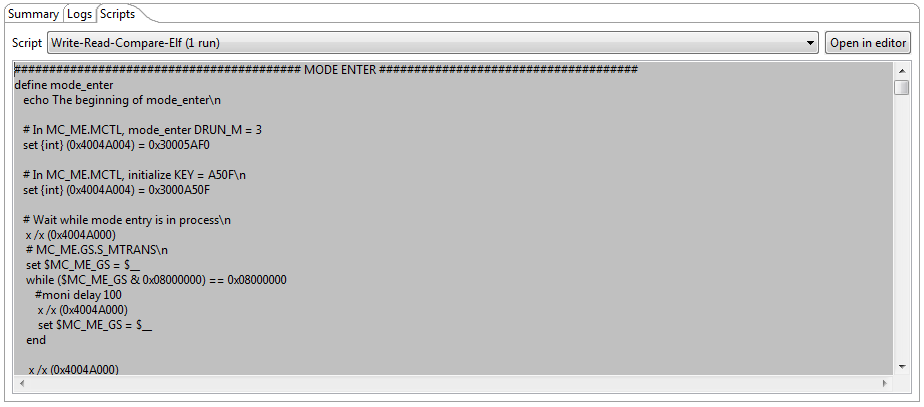
20) You can select tests from a list. To see the script behind the test, simply double-click on the name. For faster operation, ELF file versions are also provided.
21) Select the tests you wish to execute and press 'Start Validation'. For example select 'Write-Read-Compare-Elf', 'Walking Ones Elf', and 'Walking Zeros Elf'.
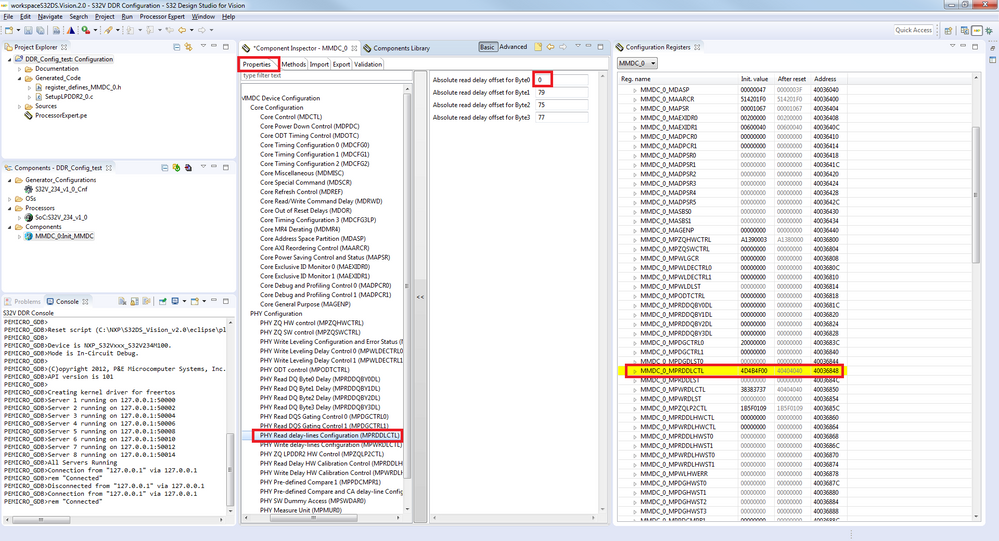
22) These tests will try different values and to determine which will work and which will not. After the test is finished, the best values are chosen and written back to the project configuration settings. To see the values change, go to the Properties tab and find 'PHY Read delay-lines Configuration' or restore the 'Configuration Registers' view and see the values changed.
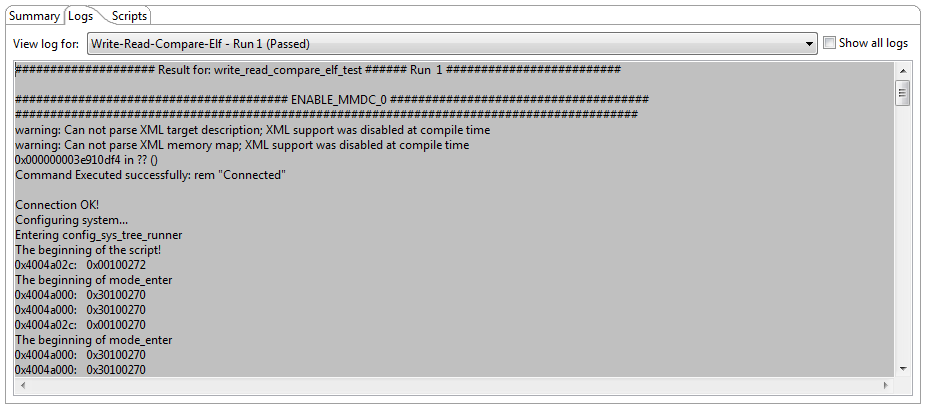
23) For each test, you can see the errors which occurred in the 'Summary' tab, Test results section. There is also Updated configuration registers section which shows the register and the new value which was written to it. For more details on the errors, there is a Log tab which displays the log for each test which was run. Finally there is a Scripts tab which shows the script for each test containing the test settings. Each test box is colored to reflect the result of the test. Clicking on different ones causes the display below to change and show the results for that test.
24) The Write Delay Calibration test scenario is very similar to the Read Delay Calibration test scenario, but instead, the Write delay-lines Configuration will be updated.
25) The Operational DDR Tests run the same tests, but no value in the configuration is changed. You can set it to run for many repetitions to test for stability.
Terminal window Method (JTAG)
This checks what settings are already uploaded in MMDC module
1) Make sure EVB is powered and connected to PC via PEMicro (Universal Multilink) or Lauterbach (to load test application) AND serial communications via USB cable(for terminal access).
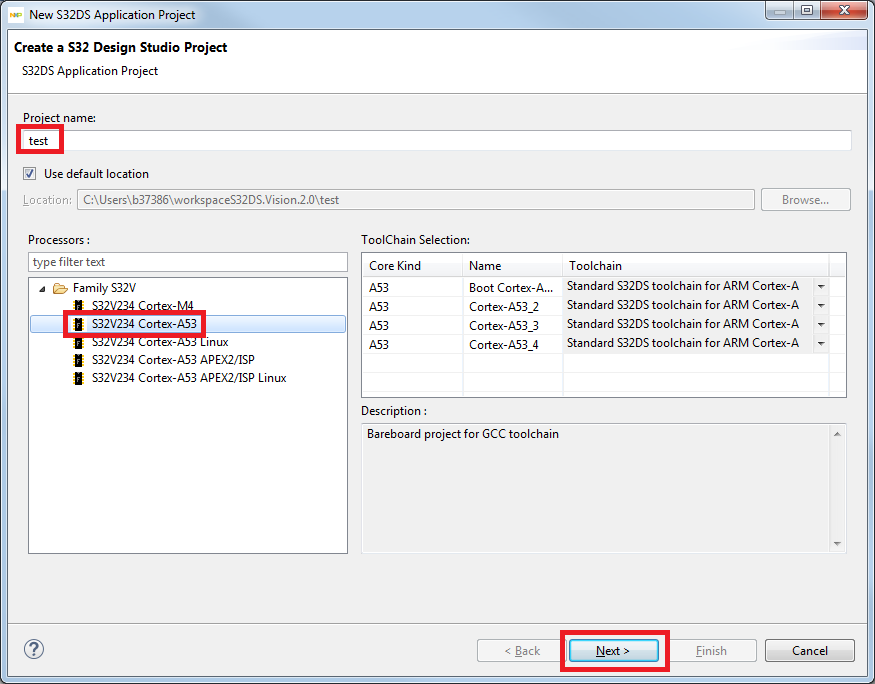
2) In S32DS, create a simple project
a. File->New->S32DS Application Project
b. Enter name 'test'
c. Select S32V234 Cortex-A53
d. Next
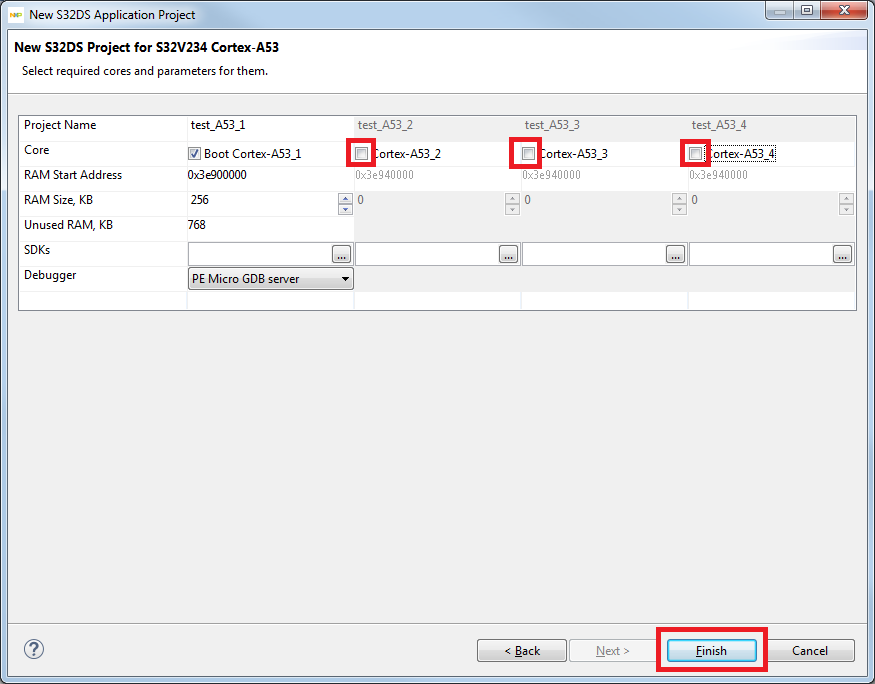
e. Uncheck boxes for cores 2-4
f. Finish
3) Setup debug configuration
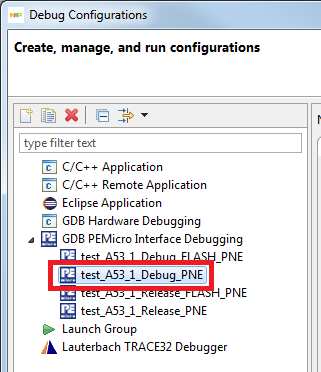
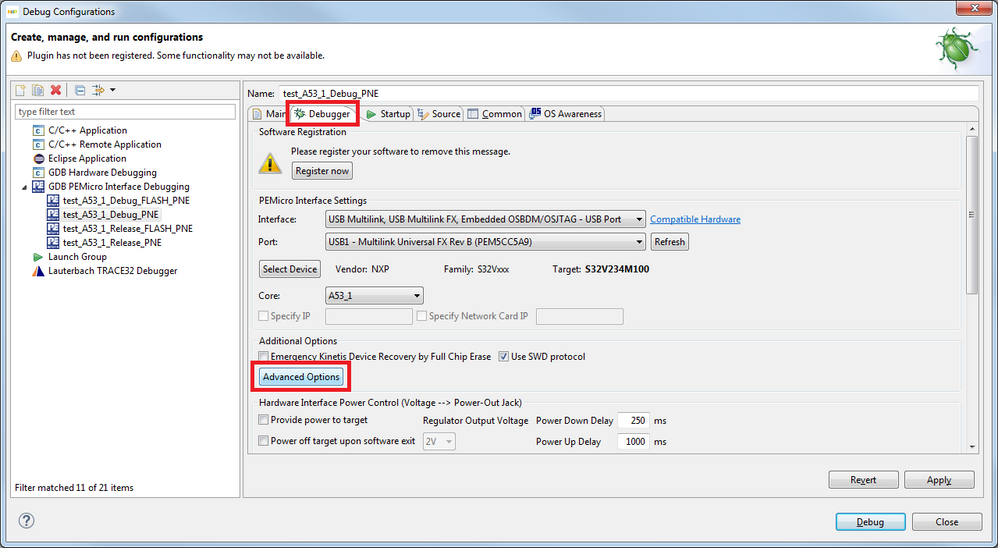
a. Run->Debug Configurations…
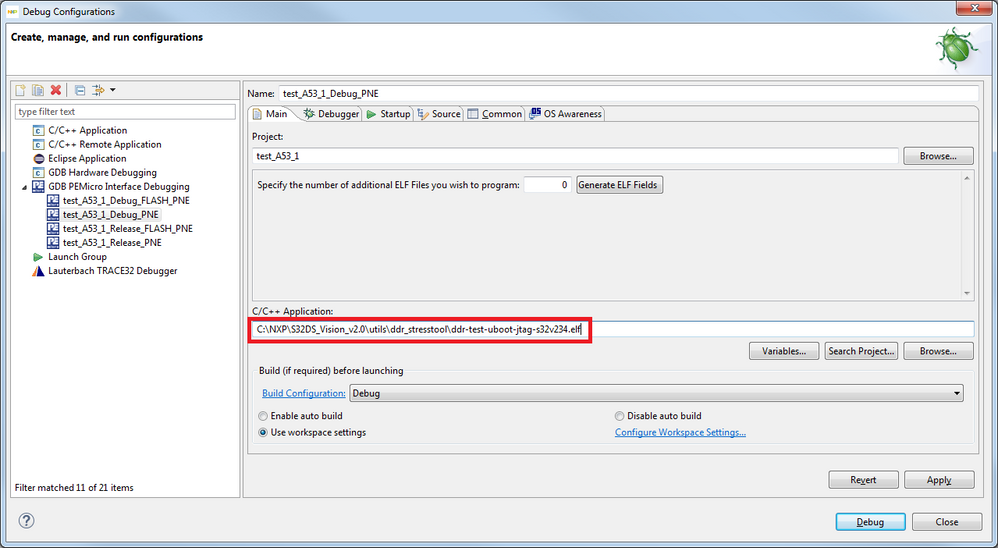
b. Select test_A53_1_PNE
c. Change C/C++ Application to C:\NXP\S32DS_Vision_v2.0\utils\ddr_stresstool\ddr-test-uboot-jtag-s32v234.elf
d. Select Debugger tab
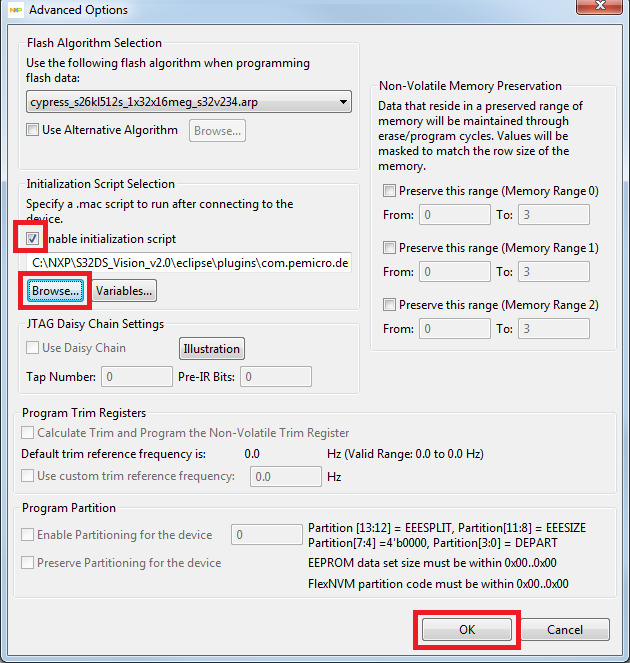
e. Click Advanced Options
f. Check box for Enable initialization script
g. Browse to find C:\NXP\S32DS_Vision_v2.0\eclipse\plugins\com.pemicro.debug.gdbjtag.pne_3.1.3.201709051622\win32\gdi\P&E\supportFiles_ARM\NXP\S32Vxxx\S32V234M100_DDR.mac
h. OK
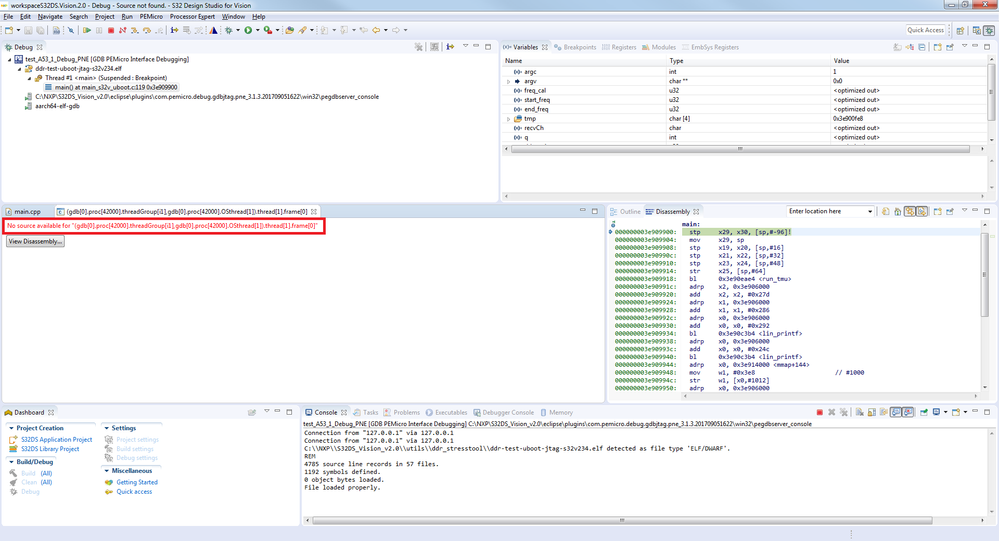
4) Click Debug. You will see error message indicating the source file could not be found. This is expected.
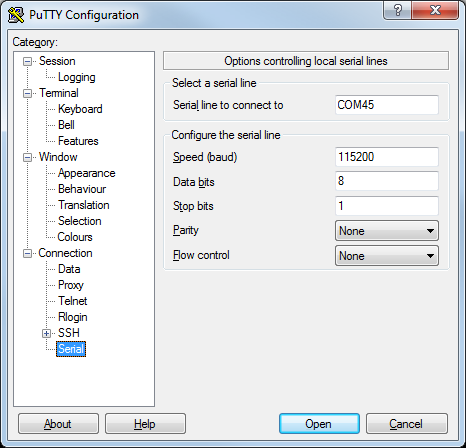
5) Open terminal (such as PuTTY.exe) and connect a serial line using the USB port you have connected to the EVB, speed set to 115200, 8 data bits, 1 stop bit, and no parity or flow control.
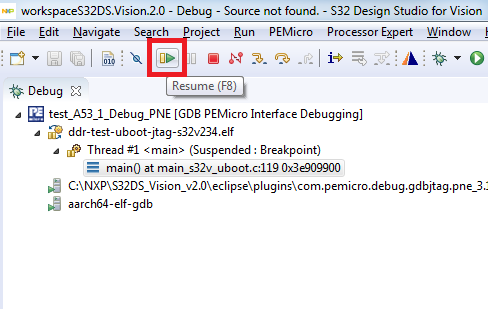
6) Click Resume in S32DS Debugger.
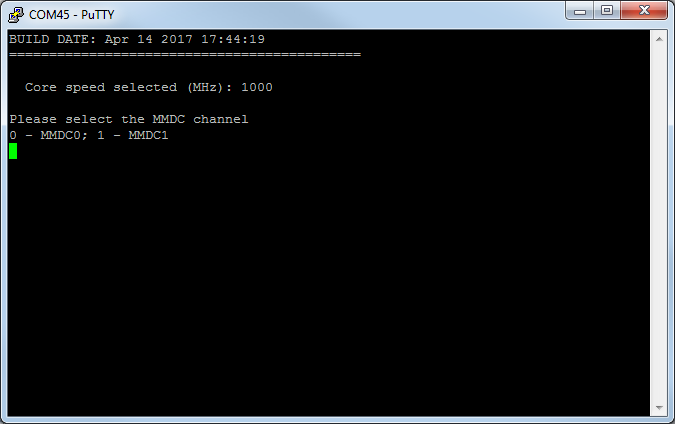
7) In terminal window, you will see the test script has started.
8) Select the MMDC channel (for example, enter 1 for MMDC1)
9) Select the DDR density (for example, enter 6 for 32MB)
10) Enter 'y' to accept the DDR Calibration
11) Enter 'y' to accept the DDR frequency of 533MHz
12) Wait and watch while the test completes.
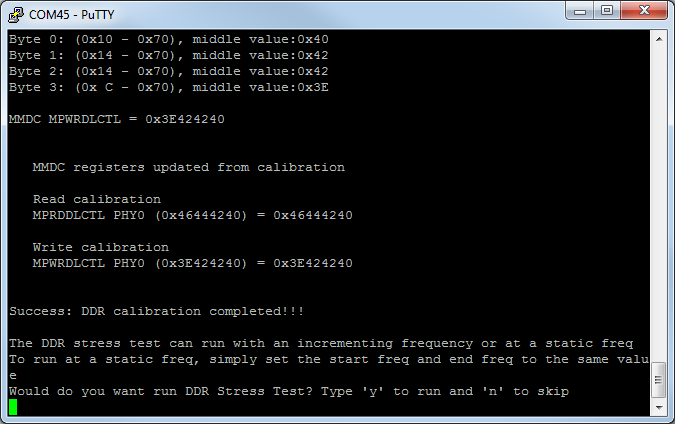
13) When the test completes, the results are shown. You will have to manually update your settings from the information displayed.
14) Next you will have the option to run the DDR Stress Test.
