- Forums
- Product Forums
- General Purpose MicrocontrollersGeneral Purpose Microcontrollers
- i.MX Forumsi.MX Forums
- QorIQ Processing PlatformsQorIQ Processing Platforms
- Identification and SecurityIdentification and Security
- Power ManagementPower Management
- Wireless ConnectivityWireless Connectivity
- RFID / NFCRFID / NFC
- Advanced AnalogAdvanced Analog
- MCX Microcontrollers
- S32G
- S32K
- S32V
- MPC5xxx
- Other NXP Products
- S12 / MagniV Microcontrollers
- Powertrain and Electrification Analog Drivers
- Sensors
- Vybrid Processors
- Digital Signal Controllers
- 8-bit Microcontrollers
- ColdFire/68K Microcontrollers and Processors
- PowerQUICC Processors
- OSBDM and TBDML
- S32M
- S32Z/E
-
- Solution Forums
- Software Forums
- MCUXpresso Software and ToolsMCUXpresso Software and Tools
- CodeWarriorCodeWarrior
- MQX Software SolutionsMQX Software Solutions
- Model-Based Design Toolbox (MBDT)Model-Based Design Toolbox (MBDT)
- FreeMASTER
- eIQ Machine Learning Software
- Embedded Software and Tools Clinic
- S32 SDK
- S32 Design Studio
- GUI Guider
- Zephyr Project
- Voice Technology
- Application Software Packs
- Secure Provisioning SDK (SPSDK)
- Processor Expert Software
- Generative AI & LLMs
-
- Topics
- Mobile Robotics - Drones and RoversMobile Robotics - Drones and Rovers
- NXP Training ContentNXP Training Content
- University ProgramsUniversity Programs
- Rapid IoT
- NXP Designs
- SafeAssure-Community
- OSS Security & Maintenance
- Using Our Community
-
- Cloud Lab Forums
-
- Knowledge Bases
- ARM Microcontrollers
- i.MX Processors
- Identification and Security
- Model-Based Design Toolbox (MBDT)
- QorIQ Processing Platforms
- S32 Automotive Processing Platform
- Wireless Connectivity
- CodeWarrior
- MCUXpresso Suite of Software and Tools
- MQX Software Solutions
- RFID / NFC
- Advanced Analog
-
- NXP Tech Blogs
- Home
- :
- ソフトウェア・フォーラム
- :
- S32 デザインスタジオ・ナレッジベース
- :
- HOWTO: Command Line GDB Debugging with S32 Debug Probe for S32G2xx
HOWTO: Command Line GDB Debugging with S32 Debug Probe for S32G2xx
- RSS フィードを購読する
- 新着としてマーク
- 既読としてマーク
- ブックマーク
- 購読
- 印刷用ページ
- 不適切なコンテンツを報告
HOWTO: Command Line GDB Debugging with S32 Debug Probe for S32G2xx
HOWTO: Command Line GDB Debugging with S32 Debug Probe for S32G2xx
The S32 Debugger included within the S32 Design Studio for S32 Platform IDE provides the ability to access the flash programming and debugging of the S32 Debug Probe via GDB command line. This document provides only the necessary commands specific to launching a debug session on NXP devices. It does not cover general GDB command line operations, these are covered in detail in the GNU communities and other public websites which are not associated with NXP.
Preparation
- Setup the software tools
- Install S32 Design Studio for S32 Platform
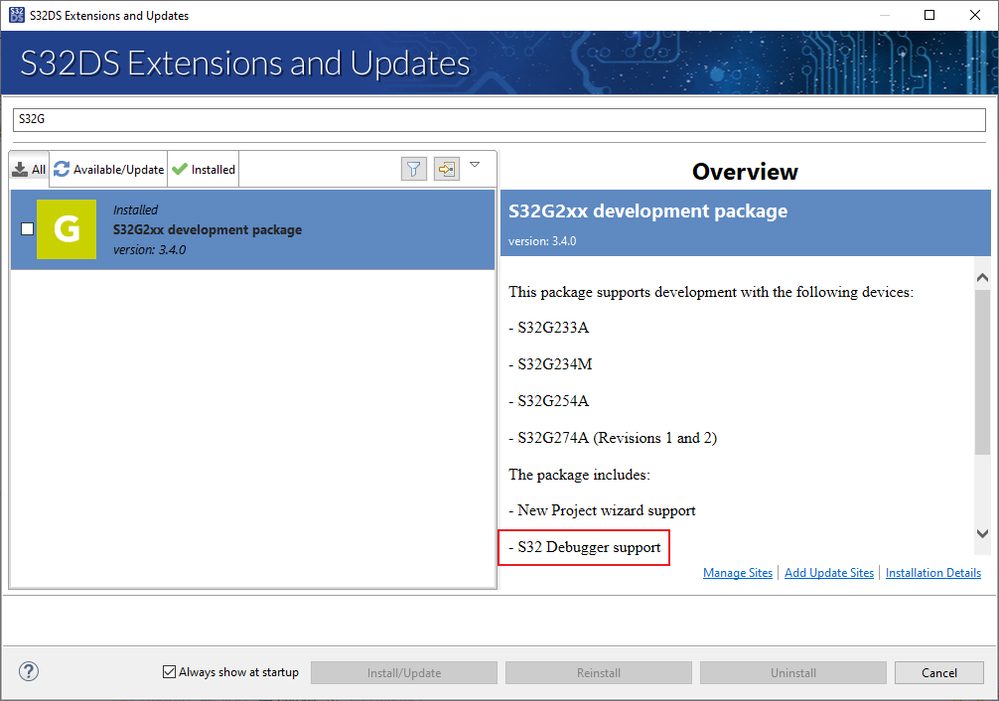
- Install the Development Package for the device you are debugging. In this case, the S32G2xx development package. This package is important as the S32 Debugger support component contains the device-specific Python scripts required for initialization of the cores.
- Setup the hardware
- Confirm the setup of the S32G274A evaluation board.
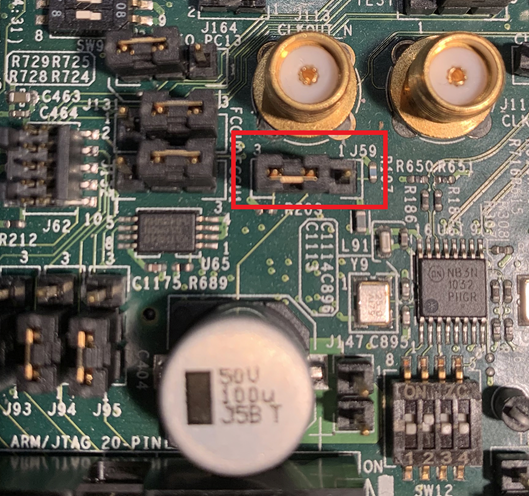
- Configure the JTAG. The S32G274A evaluation board supports both 10- and 20- pin JTAG connections. The default board configuration is set to 20-pin, change the position of the jumper J59 from 2-3(default) to 1-2, if you are using the 10 Pin JTAG interface. Both are supported by the S32 Debugger and S32 Debug Probe.
- Connect the power supply cable
- Configure the JTAG. The S32G274A evaluation board supports both 10- and 20- pin JTAG connections. The default board configuration is set to 20-pin, change the position of the jumper J59 from 2-3(default) to 1-2, if you are using the 10 Pin JTAG interface. Both are supported by the S32 Debugger and S32 Debug Probe.
- Setup the S32 Debug Probe
- Connect the S32 Debug Probe to the evaluation board via JTAG cable. Refer to the S32 Debug Probe User Manual for installation instructions. Use the JTAG connection as was confirmed in the previous step.
- Connect the S32 Debug Probe to the host PC via USB OR via Ethernet (via LAN or directly connected, and configured for static IP address) and power supply connected to USB port.
- Confirm the setup of the S32G274A evaluation board.
- Launch S32 Design Studio for S32 Platform
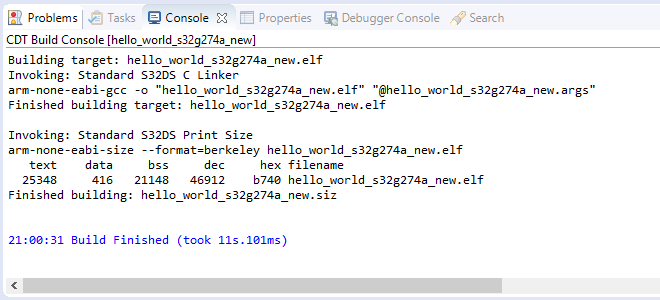
- Create new or open existing project and check that it successfully builds. If creating a new project, be sure the S32 Debugger is selected in the New Project Wizard.
Procedure
As separate debug threads need to be started for each core to be debugged, and the method for launching a debug thread differs depending upon whether it is a primary core or secondary core and if the executable image will be loaded or if the executable is already running and the debugger just needs to be attached. These scenarios will be covered by the following 3 sections:
Primary Core Load Image and Run: The application image will be loaded directly to memory by the debugger and then initialized and started. The primary core will launch any secondary cores used by the application.
Secondary Cores: The primary core has launched a secondary core, it is now running and the debugger will connect through the attach method.
Primary Core Image Already In Memory and Running: The primary core has already been initialized and launched by other means, such as via a Linux OS on the target, so the debugger will connect through the attach method without initializing or loading the image to memory.
Please proceed with the section which applies to the core for which you are starting a debug thread.
Primary Core Load Image and Run
- Prepare the initialization script for the core(s) to be debugged.
- Open the core initialization Python script:
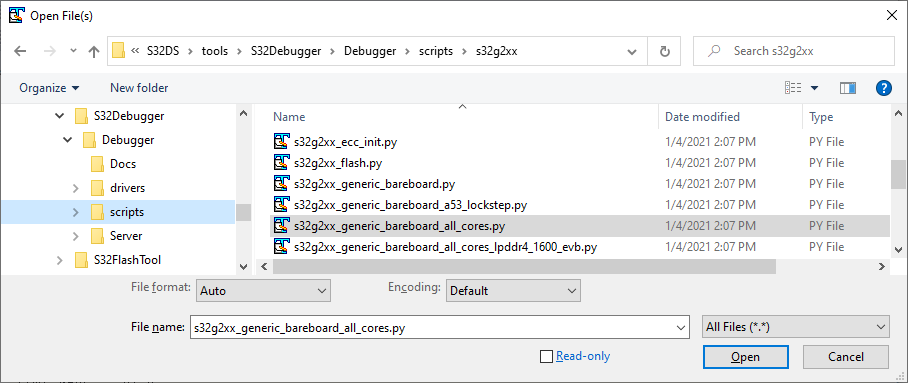
{S32DS Install Path}\S32DS\tools\S32Debugger\Debugger\scripts\s32g2xx\s32g2xx_generic_bareboard_all_cores.py - Uncomment the following lines:
#_JTAG_SPEED = 16000
#_PROBE_IP = "10.112.101.91"
#_GDB_SERVER_PORT = 45000
#_CORE_NAME = 'M7_0'
#_RESET_TYPE = "default"
#_RESET_DELAY = 1
#_REMOTE_TIMEOUT = 60
#_IS_LOGGING_ENABLED = True
This file is used by the S32 Debugger within the S32 Design Studio IDE where the settings are provided from the GUI, so these lines are commented out in order to allow the GUI settings to have control. The commented lines are provided so the script could more easily be run by the command line method. - Update the IP address line (_PROBE_IP) to match the IP address of the S32 Debug Probe which is connected to your PC. See the user guide for the S32 Debug Probe for details on how to obtain the IP address.
- Update the core name (_CORE_NAME), if necessary. See s32g2xx_context.py for complete list of supported cores.
- Save the file with a new name to preserve the original. For example, s32g2xx_gen_bb_all_c_my_probe.py. This ensures the S32 Debugger will still function correctly.
- Open the core initialization Python script:
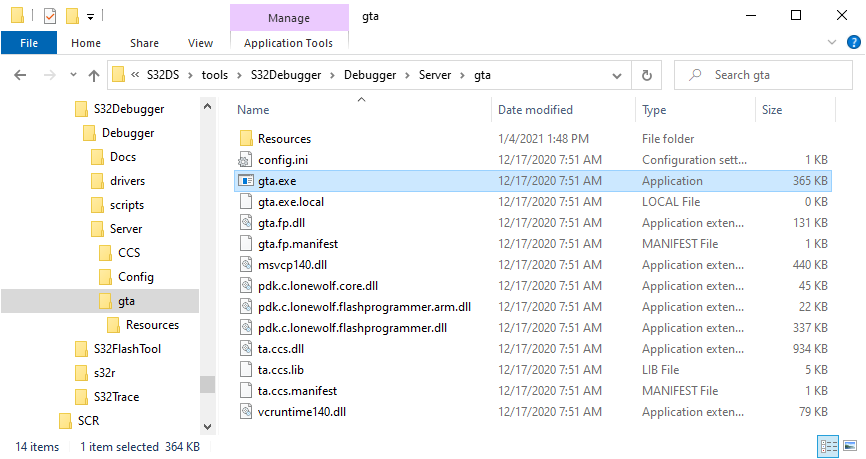
- Launch GTA server. From command prompt or Windows File Explorer run the command:
{S32DS Install Path}\S32DS\tools\S32Debugger\Debugger\Server\gta\gta.exe
Should see a window appear like this: - Ensure Environment Variable for Python is set. From command prompt, run the command:
set PYTHONPATH={S32DS Install Path}\S32DS\build_tools\msys32\mingw32\lib\python2.7;{S32DS Install Path}\S32DS\build_tools\msys32\mingw32\lib\python2.7\site-packages
- Start GDB. In a command window, run the command:
Windows OS:
{S32DS Install Path}\S32DS\tools\gdb-arm\arm32-eabi\bin\arm-none-eabi-gdb-py.exe (for arm32)
OR
{S32DS Install Path}\S32DS\tools\gdb-arm\arm64-eabi\bin\aarch64-none-elf-gdb-py.exe (for arm64)
Linux OS: arm-none-eabi-gdb-pyA (gdb) prompt should now be displayed in the command window:
- From (gdb) prompt, enter the following commands(in this order):
- source {S32DS Install Path}\\S32DS\\tools\\S32Debugger\\Debugger\\scripts\\s32g2xx\\s32g2xx_gen_bb_all_c_my_probe.py
This specifies the script for initialization. - py board_init()
This initializes the board. It should only be called for the initial core. In a multicore debugging workflow, the debugger launch for additional cores would omit this step. - py core_init()
This initializes the core specified in the initialization script in step 1.
- source {S32DS Install Path}\\S32DS\\tools\\S32Debugger\\Debugger\\scripts\\s32g2xx\\s32g2xx_gen_bb_all_c_my_probe.py
- Now standard GDB commands may be used. For example, you may wish to load an ELF file:
- file {S32DS Workspace Path}\\New_S32G_Project\\New_S32G_Project_M7_0\\Debug_RAM\\New_S32G_Project_M7_0.elf
- load
Secondary Cores
After completing the launch of debug for the primary core, it is possible to perform multicore debug by launching GDB debugging on the secondary cores.
- Some additional steps will need to be performed from within the primary core GDB session, enter the following commands:
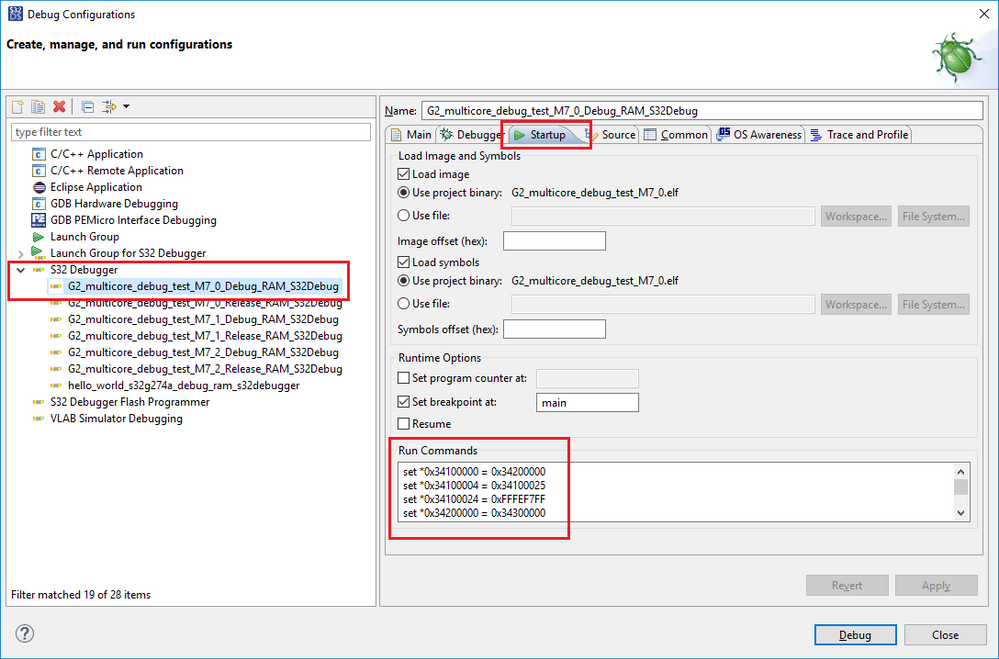
set *0x34100000 = 0x34200000
set *0x34100004 = 0x34100025
set *0x34100024 = 0xFFFEF7FF
set *0x34200000 = 0x34300000
set *0x34200004 = 0x34200025
set *0x34200024 = 0xFFFEF7FF
b main
c
These lines prepare the environment for launching debugging on secondary cores. This will allow for multicore debugging in the case of separate ELF files for each core. These can be found in the Run Commands field of the Startup tab on the Debug Configuration for the primary core within S32 Design Studio IDE, of any multicore project created from the New Application Project Wizard. Note: If there is just one ELF file for all cores, then these 'set *0x... = 0x...' commands should be skipped.
In general, it will be correct to set the break-point at main, as shown, but this might need to be changed depending on when the secondary cores are started within the project. - Prepare the initialization script for the secondary core to be debugged.
- Open the core initialization Python script:
{S32DS Install Path}\S32DS\tools\S32Debugger\Debugger\scripts\s32g2xx\s32g2xx_attach.py
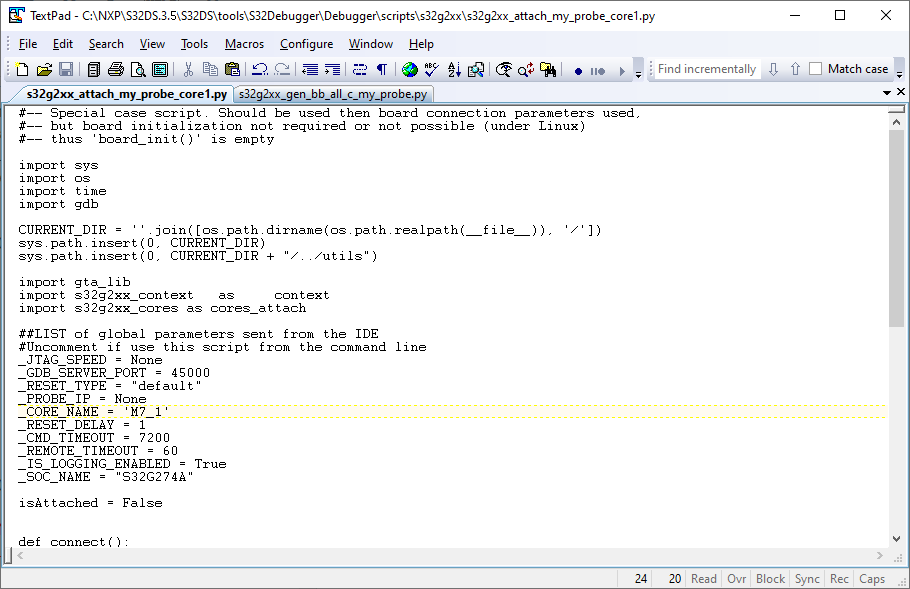
This is a different script than the one used for the primary core. It is designed to launch a debug session on a core which is already initialized and running. - Edit the script for the secondary core to be debugged. Since this script is setup for the primary core, some adjustments need to be made to setup for a secondary core
- Uncomment the following lines:
#_JTAG_SPEED = 14000
#_GDB_SERVER_PORT = "127.0.0.1:45000"
#_RESET_TYPE = "default"
#_PROBE_IP = "s32dbg:10.222.24.64"
#_CORE_NAME = 'M7'
#_RESET_DELAY = 1
#_CMD_TIMEOUT = 7200
#_REMOTE_TIMEOUT = 60
#_IS_LOGGING_ENABLED = True
#_SOC_NAME = "S32G274A" - Make the following changes to the lines:
_JTAG_SPEED = 14000 -> None
_GDB_SERVER_PORT = "127.0.0.1:45000" -> 45000
_RESET_TYPE = "default"
_PROBE_IP = "s32dbg:10.222.24.64" -> None
_CORE_NAME = 'M7' -> 'M7_1' (this should be set to match the name of the core to be debugged, see s32g2xx_context.py for complete list)
_RESET_DELAY = 1
_CMD_TIMEOUT = 7200
_REMOTE_TIMEOUT = 60
_IS_LOGGING_ENABLED = True
_SOC_NAME = "S32G274A" - Save the file with a new name to preserve the original. For example, s32g2xx_attach_my_probe_core1.py. This ensures the S32 Debugger will still function correctly.
- Uncomment the following lines:
- Open the core initialization Python script:
- The existing GTA server is used, so do not launch a new one.
- Open an new command window and follow similar steps as done for the primary core.
- Setup the Python environment variable, if not done globally
set PYTHONPATH={S32DS Install Path}\S32DS\build_tools\msys32\mingw32\lib\python2.7;{S32DS Install Path}\S32DS\build_tools\msys32\mingw32\lib\python2.7\site-packages - Start GDB
Windows OS:
{S32DS Install Path}\S32DS\tools\gdb-arm\arm32-eabi\bin\arm-none-eabi-gdb-py.exe (for arm32)
OR
{S32DS Install Path}\S32DS\tools\gdb-arm\arm64-eabi\bin\aarch64-none-elf-gdb-py.exe (for arm64)
Linux OS: arm-none-eabi-gdb-py
A (gdb) prompt should now be displayed in the command window:
- Setup the Python environment variable, if not done globally
- From (gdb) prompt, enter the following commands(in this order):
- source {S32DS Install Path}\\S32DS\\tools\\S32Debugger\\Debugger\\scripts\\s32g2xx\\s32g2xx_attach_my_probe_core1.py
This specifies the script for initialization. - We will not execute the py board_init() as this was already done for the primary core.
- py core_init()
This initializes the core specified in the initialization script in step 2.
- source {S32DS Install Path}\\S32DS\\tools\\S32Debugger\\Debugger\\scripts\\s32g2xx\\s32g2xx_attach_my_probe_core1.py
- Now standard GDB commands may be used. For example, you may wish to load an ELF file:
- file {S32DS Workspace Path}\\S32G_MultiCore\\S32G_MultiCore_M7_1\\Debug_RAM\\S32G_MultiCore_M7_1.elf
- load
- Repeat 3-6 for each additional core.
Primary Core Image Already in Memory and Running
The core is running and does not need to be initialized.
- Prepare the initialization script for the core to be debugged.
- Open the core initialization Python script:
{S32DS Install Path}\S32DS\tools\S32Debugger\Debugger\scripts\s32g2xx\s32g2xx_attach.py
This is a different script than the one used for the primary core. It is designed to launch a debug session on a core which is already initialized and running. - Edit the script for the secondary core to be debugged. Since this script is setup for the primary core, some adjustments need to be made to setup for a secondary core
- Uncomment the following lines:
#_JTAG_SPEED = 14000
#_GDB_SERVER_PORT = "127.0.0.1:45000"
#_RESET_TYPE = "default"
#_PROBE_IP = "s32dbg:10.222.24.64"
#_CORE_NAME = 'M7'
#_RESET_DELAY = 1
#_CMD_TIMEOUT = 7200
#_REMOTE_TIMEOUT = 60
#_IS_LOGGING_ENABLED = True
#_SOC_NAME = "S32G274A" - Make the following changes to the lines:
_JTAG_SPEED = 14000
_GDB_SERVER_PORT = "127.0.0.1:45000" -> 45000
_RESET_TYPE = "default"
_PROBE_IP = "s32dbg:10.222.24.64" -> (enter the IP address of your probe)
_CORE_NAME = 'M7' -> 'M7_0' (this should be set to match the name of the core to be debugged, see s32g2xx_context.py for complete list)
_RESET_DELAY = 1
_CMD_TIMEOUT = 7200
_REMOTE_TIMEOUT = 60
_IS_LOGGING_ENABLED = True
_SOC_NAME = "S32G274A" - Save the file with a new name to preserve the original. For example, s32g2xx_attach_my_probe_core0.py. This ensures the S32 Debugger will still function correctly.
- Uncomment the following lines:
- Open the core initialization Python script:
- Launch GTA server. From command prompt or Windows File Explorer run the command:
{S32DS Install Path}\S32DS\tools\S32Debugger\Debugger\Server\gta\gta.exe
Should see a window appear like this: - Ensure Environment Variable for Python is set. From command prompt, run the command:
set PYTHONPATH={S32DS Install Path}\S32DS\build_tools\msys32\mingw32\lib\python2.7;{S32DS Install Path}\S32DS\build_tools\msys32\mingw32\lib\python2.7\site-packages - Start GDB. In a command window, run the command:
Windows OS:
{S32DS Install Path}\S32DS\tools\gdb-arm\arm32-eabi\bin\arm-none-eabi-gdb-py.exe (for arm32)
OR
{S32DS Install Path}\S32DS\tools\gdb-arm\arm64-eabi\bin\aarch64-none-elf-gdb-py.exe (for arm64)
Linux OS: arm-none-eabi-gdb-py
A (gdb) prompt should now be displayed in the command window: - From (gdb) prompt, enter the following commands(in this order):
- source {S32DS Install Path}\\S32DS\\tools\\S32Debugger\\Debugger\\scripts\\s32g2xx\\s32g2xx_attach_my_probe_core0.py
This specifies the script for debugger initialization. - Do not execute the py board_init() as this will initialize the board, and reset the currently executing application, which is not desired for this case.
- py core_init()
This initializes the debugger connection to the core specified in the initialization script in step 1.
- source {S32DS Install Path}\\S32DS\\tools\\S32Debugger\\Debugger\\scripts\\s32g2xx\\s32g2xx_attach_my_probe_core0.py
- Now standard GDB commands may be used. For example, you may wish to load an ELF file:
- file {S32DS Workspace Path}\\S32G_Multicore\\S32G_Multicore_M7_0\ \Debug_RAM\\S32G_Multicore_M7_0.elf
- load
- After completing the launch of debug for the primary core, it is possible to perform multicore debug by launching GDB debugging on the secondary cores. See section ‘Secondary Cores’ for each additional core to be debugged.
- 既読としてマーク
- 新着としてマーク
- ブックマーク
- ハイライト
- 印刷
- 不適切なコンテンツを報告
Hello Team,
I am trying to enable command line semi hosting for S32g2 using s32 debug probe and while following the above procedure for Primary Core Load Image and Run,
py board_init() give the below output but py core_init() is failed and gta server crashes.
Please find the attached images for output when py board_init() is exceuted.
Since the gta server window also crashes after core_init() execution, it not possible to debug or identify the reason for failure. please provide the support to identify this issue.
