- Forums
- Product Forums
- General Purpose MicrocontrollersGeneral Purpose Microcontrollers
- i.MX Forumsi.MX Forums
- QorIQ Processing PlatformsQorIQ Processing Platforms
- Identification and SecurityIdentification and Security
- Power ManagementPower Management
- Wireless ConnectivityWireless Connectivity
- RFID / NFCRFID / NFC
- Advanced AnalogAdvanced Analog
- MCX Microcontrollers
- S32G
- S32K
- S32V
- MPC5xxx
- Other NXP Products
- S12 / MagniV Microcontrollers
- Powertrain and Electrification Analog Drivers
- Sensors
- Digital Signal Controllers
- Vybrid Processors
- ColdFire/68K Microcontrollers and Processors
- 8-bit Microcontrollers
- PowerQUICC Processors
- OSBDM and TBDML
- S32M
-
- Solution Forums
- Topics
- Mobile Robotics - Drones and RoversMobile Robotics - Drones and Rovers
- NXP Training ContentNXP Training Content
- University ProgramsUniversity Programs
- Rapid IoT
- NXP Designs
- SafeAssure-Community
- OSS Security & Maintenance
- Using Our Community
-
- Software Forums
- MCUXpresso Software and ToolsMCUXpresso Software and Tools
- CodeWarriorCodeWarrior
- MQX Software SolutionsMQX Software Solutions
- Model-Based Design Toolbox (MBDT)Model-Based Design Toolbox (MBDT)
- FreeMASTER
- eIQ Machine Learning Software
- Embedded Software and Tools Clinic
- S32 SDK
- S32 Design Studio
- GUI Guider
- Zephyr Project
- Voice Technology
- Application Software Packs
- Secure Provisioning SDK (SPSDK)
- Processor Expert Software
-
- Cloud Lab Forums
-
- Knowledge Bases
- ARM Microcontrollers
- Identification and Security
- i.MX Processors
- Model-Based Design Toolbox (MBDT)
- QorIQ Processing Platforms
- S32 Automotive Processing Platform
- CodeWarrior
- Wireless Connectivity
- MCUXpresso Suite of Software and Tools
- MQX Software Solutions
- RFID / NFC
- Advanced Analog
-
- Home
- :
- Model-Based Design Toolbox (MBDT)
- :
- Model-Based Design Toolbox (MBDT)
- :
- S32k144 Simulation Time
S32k144 Simulation Time
- Subscribe to RSS Feed
- Mark Topic as New
- Mark Topic as Read
- Float this Topic for Current User
- Bookmark
- Subscribe
- Mute
- Printer Friendly Page
- Mark as New
- Bookmark
- Subscribe
- Mute
- Subscribe to RSS Feed
- Permalink
- Report Inappropriate Content
Hello @mariuslucianand
I have few queries related to NXP S32k144 and MATLAB programing.
1) What does Fixed Step time mean and what factors decide its value?
2) how can we calculate the execution Speed on S32k144 for any code which we develop?
3) How can we run various blocks or subsystems at different run rates to acquire data from various sensors (Multithreading) and how this can be tested on a Hardware(Here S32k144)
Solved! Go to Solution.
- Mark as New
- Bookmark
- Subscribe
- Mute
- Subscribe to RSS Feed
- Permalink
- Report Inappropriate Content
Hello @rathi_tg,
I had a look at your models.
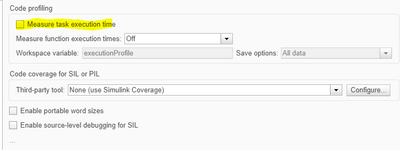
Profiler. The reason for the compile error was that the Measure task execution time option in Simulink settings was checked. This option is used for the PIL and does not work on standalone models. On standalone models, the profiler block works independently of Matlab environment. Basically, the block uses a timer counter value. It stores the timer at the beginning of the function/atomic subsystem where it is placed and stores the counter value just before exiting from that function. By subtracting those values, you get in TICKS the duration.
In our case, I've added the Profiler block and selected Index:0. This index is very important because it stores the value inside a variable called profile_buffer[index] which can be accessed from FreeMaster (more details here https://community.nxp.com/t5/NXP-Model-Based-Design-Tools/How-do-I-use-the-Profiler-Function-correct...
I've added a FreeMaster project and got the execution time about 21 ticks, which means 1.01 uS.
With a logic analyzer, we can see that the step function (when the led is toggled) is called every millisecond, as expected, because the step function, takes less than 1millisecond.
CAn_test
For this example, I did the exact same thing. I have divided the main model into 3 parts. LED, FUNCTION, and CAN with the mention that I have connected nothing to the CAN output pins, so the measured "transfer" subsystem is not accurate at all.
You can see that the Matlab functions code takes 2.8 milliseconds. The model time is 1 ms, so the PIT triggers the step, waits 2.8 milliseconds until the step function is completed, clears the PIT flags and after 3 ms from the step call another step function is executed. Same, 3ms are measured using the logic analyzer.
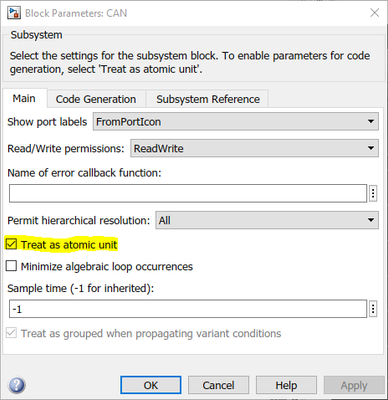
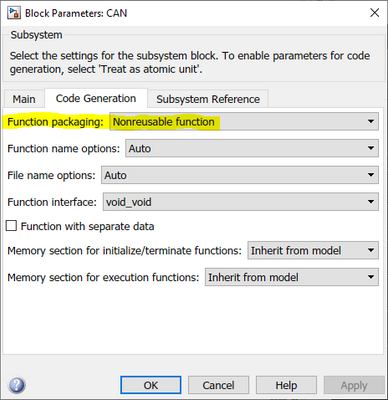
To make a subsystem eligible for the profiling block, once you create the subsystem that you want to measure, please right-click on it > Block Paramters > Check "Treat as atomic unit" and make it as "Nonreusable function". It also works with "Reusable function" too.
Please find the attached models and the attached freeMaster project.
Hope this helps,
Marius
- Mark as New
- Bookmark
- Subscribe
- Mute
- Subscribe to RSS Feed
- Permalink
- Report Inappropriate Content
Hello @mariuslucianand
I would thankyou for such a detail Explanation.
I have made few observations and would like to share to get more information.
1) Lets take a scenario were my compilation time of the entire program is 4msec and I have set my step size to be 1msec.So how will the system behave? Wil the code Execute remaining 3msec.
2) I am using profiler but i always get a built time Error. I have attached the Code with File Name "Profiler".
3) I have Attached an other file Can_Test.
When I run the code on S32k144 with the MATLAB functions Comment Out it takes 0.001msec.
But, if I use the MATLAB Function which converts a Floating point into two bytes of Unit8 to transmit via CAN it takes 3msec of time.
the observation of time is done on pin PTD15 as it is kept to toggle.
I would like to know why the MATLAB function take more time to execute and if these can not be minimized how can i transmit a floating point on CAN which takes lesser amount of time to execute
Regards
Gopal Rathi.
- Mark as New
- Bookmark
- Subscribe
- Mute
- Subscribe to RSS Feed
- Permalink
- Report Inappropriate Content
Hello @rathi_tg,
I had a look at your models.
Profiler. The reason for the compile error was that the Measure task execution time option in Simulink settings was checked. This option is used for the PIL and does not work on standalone models. On standalone models, the profiler block works independently of Matlab environment. Basically, the block uses a timer counter value. It stores the timer at the beginning of the function/atomic subsystem where it is placed and stores the counter value just before exiting from that function. By subtracting those values, you get in TICKS the duration.
In our case, I've added the Profiler block and selected Index:0. This index is very important because it stores the value inside a variable called profile_buffer[index] which can be accessed from FreeMaster (more details here https://community.nxp.com/t5/NXP-Model-Based-Design-Tools/How-do-I-use-the-Profiler-Function-correct...
I've added a FreeMaster project and got the execution time about 21 ticks, which means 1.01 uS.
With a logic analyzer, we can see that the step function (when the led is toggled) is called every millisecond, as expected, because the step function, takes less than 1millisecond.
CAn_test
For this example, I did the exact same thing. I have divided the main model into 3 parts. LED, FUNCTION, and CAN with the mention that I have connected nothing to the CAN output pins, so the measured "transfer" subsystem is not accurate at all.
You can see that the Matlab functions code takes 2.8 milliseconds. The model time is 1 ms, so the PIT triggers the step, waits 2.8 milliseconds until the step function is completed, clears the PIT flags and after 3 ms from the step call another step function is executed. Same, 3ms are measured using the logic analyzer.
To make a subsystem eligible for the profiling block, once you create the subsystem that you want to measure, please right-click on it > Block Paramters > Check "Treat as atomic unit" and make it as "Nonreusable function". It also works with "Reusable function" too.
Please find the attached models and the attached freeMaster project.
Hope this helps,
Marius
- Mark as New
- Bookmark
- Subscribe
- Mute
- Subscribe to RSS Feed
- Permalink
- Report Inappropriate Content
Thank you for such a brief explanation.
Here MATLAB function takes longer time to convert the data. By any means is their any possibility to reduces the conversion time.
I have added similar observation
Thanks a lot !!!
Regards
Gopal Rathi.
- Mark as New
- Bookmark
- Subscribe
- Mute
- Subscribe to RSS Feed
- Permalink
- Report Inappropriate Content
Hello @rathi_tg ,
For the first question, if the step takes more time to execute than the sample time, the code will execute the entire step function.
Let me explain based on your scenario. If you set the sample time at 1ms, the model configures an LPIT timer to trigger an interrupt every 1ms. Every 1ms, an interrupt will trigger the step function to be executed. So ideally, the code in the main Simulink model should take less than 1ms to not lose any LPIT trigger. If the step time exceeds the sample time, the step function is not exited and continued to be executed. The next execution is scheduled to start with the next LPIT trigger if the step function is not executing.
In the above drawing ( you have to admit I am a little artist
The purple task represents a strange execution. The first time it takes 1.5 ms to be executed. So the next trigger is at 2. But then the Step takes only 0.75, the next execution is started at 3.
Your case is closer to the red execution (in my drawing takes about 2.5 ms, but for 4 ms is the same). So the next execution starts when the next LPIT trigger appears.
For the examples you've sent I will please ask you to give me some more time due to an urgent task that I have to finish for my daily work here at NXP. I promise I will reply to you here asap, starting with the second half of the next week.
Hope this helps,
Marius
- Mark as New
- Bookmark
- Subscribe
- Mute
- Subscribe to RSS Feed
- Permalink
- Report Inappropriate Content
Hello @rathi_tg ,
Let's try to answer each question:
1) What does Fixed Step time mean and what factors decide its value?
If you refer to the Solver selection, please have a look at the MathWorks documentation https://www.mathworks.com/help/simulink/ug/fixed-step-solvers-in-simulink.html
If you refer to the Fixed-step size, which in my case is set to 0.1 and not auto, this represents the execution frequency of the main model. Most of the blocks that appear in the main model (except the Config blocks and Interrupt blocks) generates the C code in a function called step_function. This function is called from an interrupt every Fixed step size value you type in the model settings. More details here https://community.nxp.com/t5/NXP-Model-Based-Design-Tools/MBDT-blocks-for-measuring-Idle-Time-or-Pro...
But be aware of the fact that your model, can take a longer execution time than the one typed in the input box which may cause a strange execution on the target. For this, you have to profile the code and see how much time the code execution takes. Maybe some optimization is required.
2) how can we calculate the execution Speed on S32k144 for any code which we develop?
In MBDT we do offer a profiler block. Basically, this block uses a physical timer value to measure the execution time for the subsystem inside this block is placed. The output is in ticks but we have a thread dedicated here that can help you to translate from ticks to time.
3) How can we run various blocks or subsystems at different run rates to acquire data from various sensors (Multithreading) and how this can be tested on Hardware(Here S32k144)
MBDT does not offer a solution using an RTOS, but luckily MathWorks offers a mechanism to achieve that https://www.mathworks.com/help/rtw/ug/modeling-for-multitasking-execution.html
And also, one of our Community members made a great article on how to create multitasking using Simulink capabilities on the S32K144. https://community.nxp.com/t5/NXP-Model-Based-Design-Tools/How-to-Multitasking-on-S32K144-MBDT-Simuli...
Hope the shared links help you!
Regards,
Marius


