- Forums
- Product Forums
- General Purpose MicrocontrollersGeneral Purpose Microcontrollers
- i.MX Forumsi.MX Forums
- QorIQ Processing PlatformsQorIQ Processing Platforms
- Identification and SecurityIdentification and Security
- Power ManagementPower Management
- Wireless ConnectivityWireless Connectivity
- RFID / NFCRFID / NFC
- Advanced AnalogAdvanced Analog
- MCX Microcontrollers
- S32G
- S32K
- S32V
- MPC5xxx
- Other NXP Products
- S12 / MagniV Microcontrollers
- Powertrain and Electrification Analog Drivers
- Sensors
- Vybrid Processors
- Digital Signal Controllers
- 8-bit Microcontrollers
- ColdFire/68K Microcontrollers and Processors
- PowerQUICC Processors
- OSBDM and TBDML
- S32M
- S32Z/E
-
- Solution Forums
- Software Forums
- MCUXpresso Software and ToolsMCUXpresso Software and Tools
- CodeWarriorCodeWarrior
- MQX Software SolutionsMQX Software Solutions
- Model-Based Design Toolbox (MBDT)Model-Based Design Toolbox (MBDT)
- FreeMASTER
- eIQ Machine Learning Software
- Embedded Software and Tools Clinic
- S32 SDK
- S32 Design Studio
- GUI Guider
- Zephyr Project
- Voice Technology
- Application Software Packs
- Secure Provisioning SDK (SPSDK)
- Processor Expert Software
- Generative AI & LLMs
-
- Topics
- Mobile Robotics - Drones and RoversMobile Robotics - Drones and Rovers
- NXP Training ContentNXP Training Content
- University ProgramsUniversity Programs
- Rapid IoT
- NXP Designs
- SafeAssure-Community
- OSS Security & Maintenance
- Using Our Community
-
- Cloud Lab Forums
-
- Knowledge Bases
- ARM Microcontrollers
- i.MX Processors
- Identification and Security
- Model-Based Design Toolbox (MBDT)
- QorIQ Processing Platforms
- S32 Automotive Processing Platform
- Wireless Connectivity
- CodeWarrior
- MCUXpresso Suite of Software and Tools
- MQX Software Solutions
- RFID / NFC
- Advanced Analog
-
- NXP Tech Blogs
- Home
- :
- Model-Based Design Toolbox (MBDT)
- :
- Model-Based Design Toolbox (MBDT)
- :
- Re: Code Execution Measurement using Profiling Function Block
Code Execution Measurement using Profiling Function Block
- Subscribe to RSS Feed
- Mark Topic as New
- Mark Topic as Read
- Float this Topic for Current User
- Bookmark
- Subscribe
- Mute
- Printer Friendly Page
Code Execution Measurement using Profiling Function Block
- Mark as New
- Bookmark
- Subscribe
- Mute
- Subscribe to RSS Feed
- Permalink
- Report Inappropriate Content
Hi,
I'm trying to measure execution time for the model run in PIL Simulation mode using Profiler function block.
But I'm facing issue in checking the output in Freemaster tool V2.0. I have attached the sample model.
Kindly tell how to fix the issue inorder to check the output with Freemaster tool V2.0
Thanks,
Sindhuja Bala.
- Mark as New
- Bookmark
- Subscribe
- Mute
- Subscribe to RSS Feed
- Permalink
- Report Inappropriate Content
Hi sindhujabala
If you wish to test the Processor-In-The-Loop execution time with the dedicated Profiler Function Simulink Block then you don't have to use the FreeMASTER
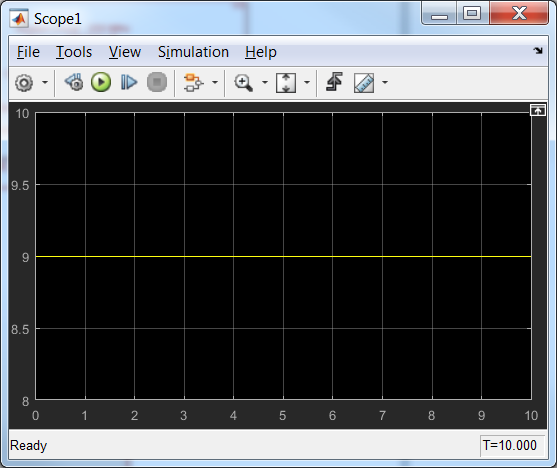
Since PIL is a co-simulation between code that runs on Host PC and the code that runs on the actual HW, you could use the standard Simulink Scope to check the results - how much time the function needs to be executed.
All you have to do is:
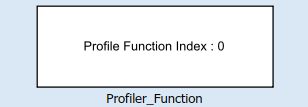
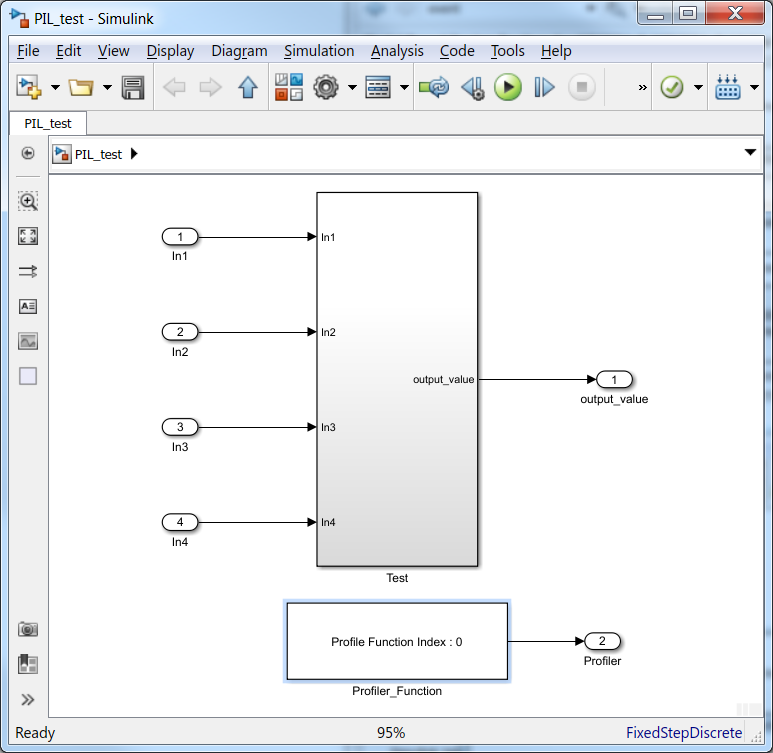
1: add the Profiling function block in your PIL model
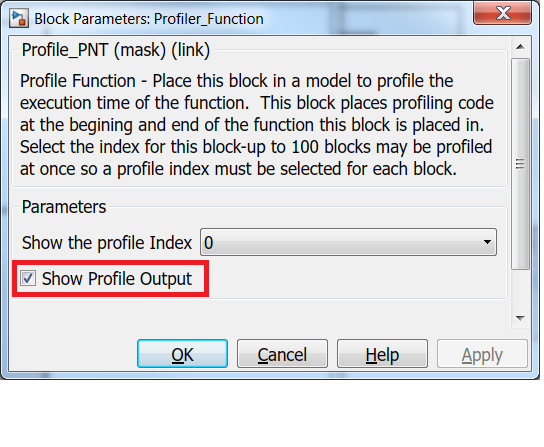
2: Configure the block to "Show Profile Output"
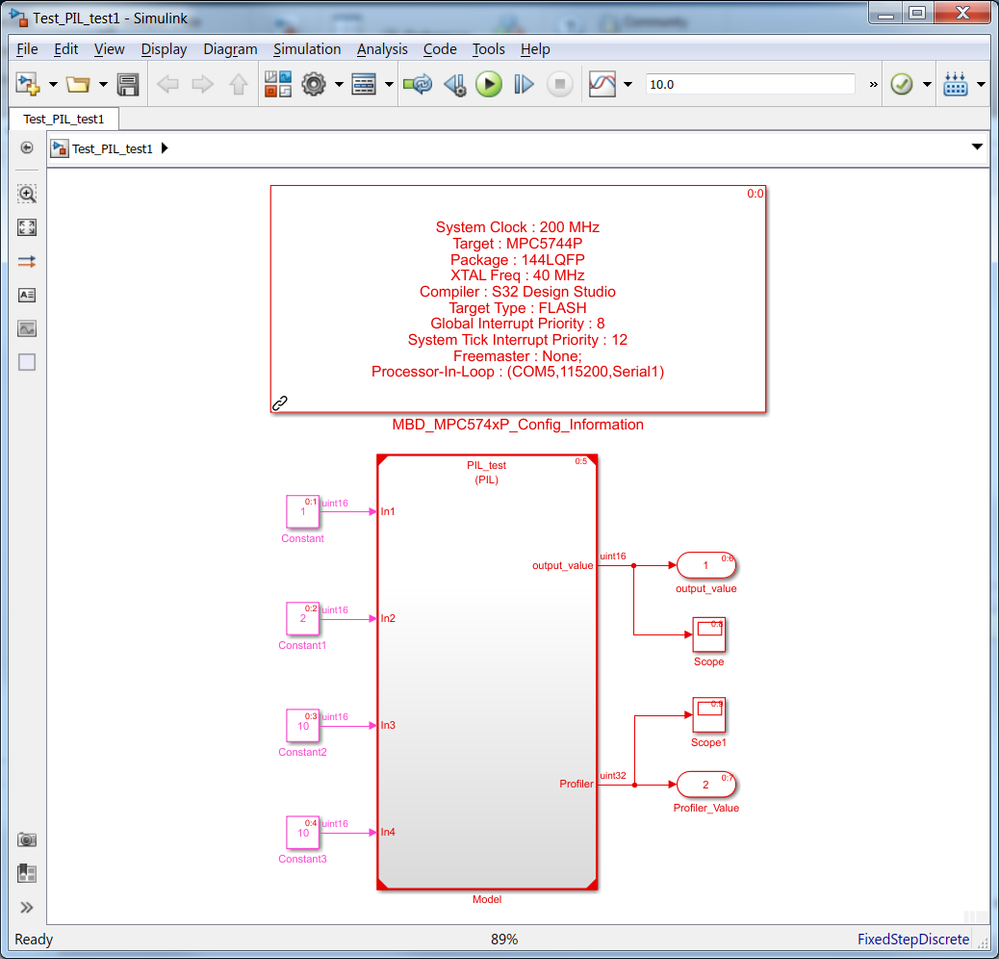
Then all you need to do in your harness test is to plot that PIL Profiler output.
For your particular model the result is shown below:
Your model contained some mistakes which i have corrected, check the attachement. If you want to learn more about PIL please check this video: Video Link : 7845
- Mark as New
- Bookmark
- Subscribe
- Mute
- Subscribe to RSS Feed
- Permalink
- Report Inappropriate Content
Hi,
Thanks for the reply.
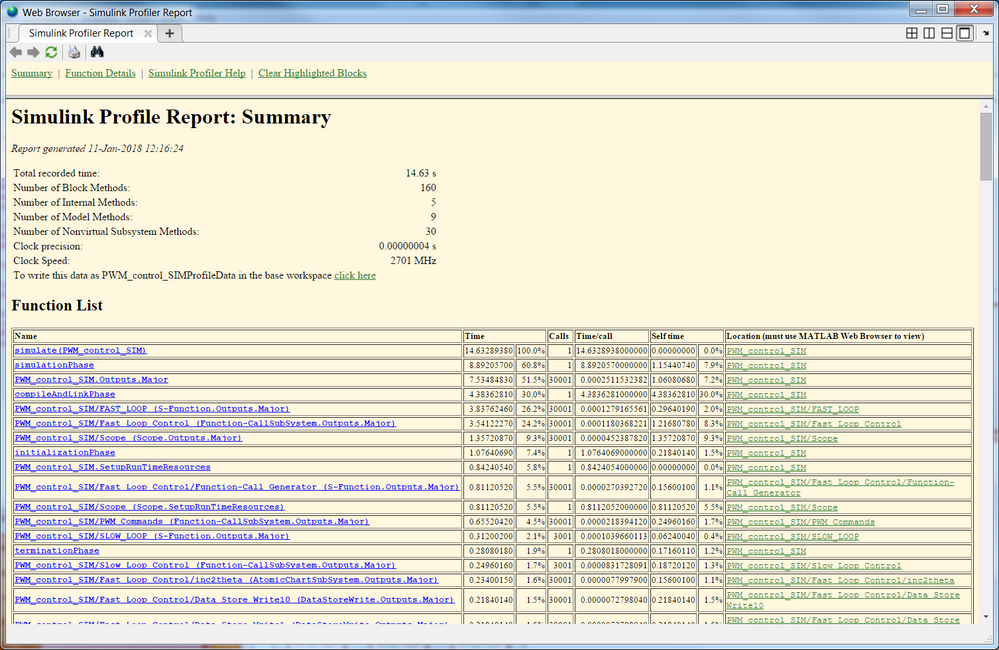
Is it possible to get profiling report giving the details of code execution time for each function and number of time function called.
- Mark as New
- Bookmark
- Subscribe
- Mute
- Subscribe to RSS Feed
- Permalink
- Report Inappropriate Content
Hello,
Are you looking for this kind of report?
For the moment that is not possible on PIL nor actual hardware. That is a function provided by MATLAB but was not yet enabled on existing toolboxes. For the PIL and actual HW application we can only show the actual execution cycles.
Nonetheless, you have a relative simple alternative: You could create subsystem for the functions you need to profile and add in each one a Profile Function. We can profile up to 100 function in a single run by changing the Profiler index.
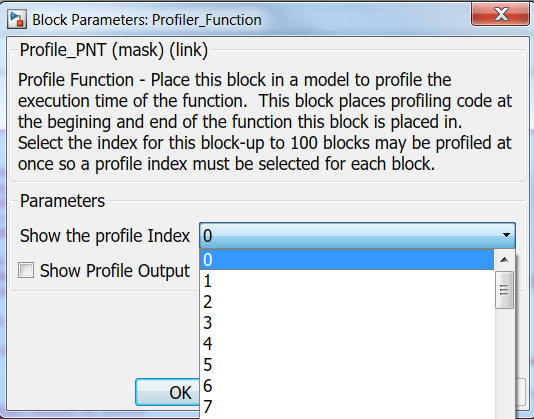
Hope this helps!
Daniel
- Mark as New
- Bookmark
- Subscribe
- Mute
- Subscribe to RSS Feed
- Permalink
- Report Inappropriate Content
I'm looking for code execution profile report like this.
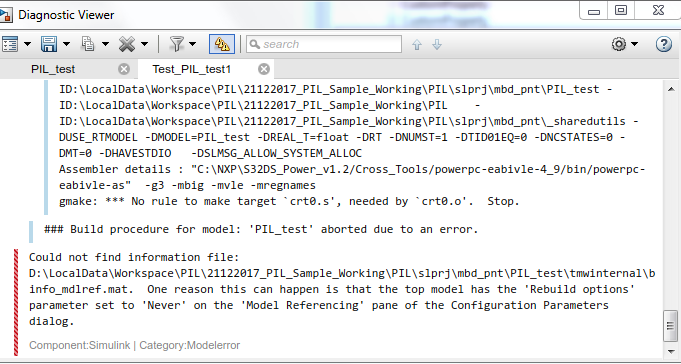
For collecting the Profiling data there is an option in Code generation pane verification tab, Measure task execution time and Measure function execution times checkboxes has to be checked . But I'm getting Model error when simulation done. I have tried with your sample model also.
Herewith attached the error screenshot
Kindly confirm the reason.
- Mark as New
- Bookmark
- Subscribe
- Mute
- Subscribe to RSS Feed
- Permalink
- Report Inappropriate Content
Hi Sindhuja Bala,
I did confirm that in the previous reply :-)
For the moment that is not possible on PIL nor actual hardware.
For PIL/HW targets MATLAB provides an API that needs a HW timer implementation. In this case that API is left empty because we have not implemented yet that functionality. There are multiple issues in that regards especially when the timer overflows. We have done various tests and so far we did not found a reliable method to get timestamps from the real hardware. We are working with MATHWORKS team to find a resolution for such issues and hope we could enable such function in future releases.
Thank you!
Daniel
- Mark as New
- Bookmark
- Subscribe
- Mute
- Subscribe to RSS Feed
- Permalink
- Report Inappropriate Content
I am working with Matlab 2020b and NXP S32K144, I wanted to ask about the issue of the profiling with Mathworks for report generation of each function is it solved or not?
- Mark as New
- Bookmark
- Subscribe
- Mute
- Subscribe to RSS Feed
- Permalink
- Report Inappropriate Content
- Mark as New
- Bookmark
- Subscribe
- Mute
- Subscribe to RSS Feed
- Permalink
- Report Inappropriate Content
Hi Daniel,
Thanks for your continuous support and detailed explanation.
