DEVKIT-MPC5748G is in reset state
I have three DEVKIT-MPC5748G boards,but they are in a reset state. MPC5748G Cannot attached JTAG.I tried to solve this problem according to the method mentioned in the link.
MPC5748G Cannot attached JTAG after erase all?
One of the boards can attached JTAG,but the other two are still in a reset state.
I started using the DEVKIT-MPC5748G, successfully tried to compile,
flash and debug the simple samples with the S32 Design Studio and ran
successfully through the mini tutorial to create the blinking LED application
with the Processor Expert. Then I modified my existing MPC5643L code,
flashed it - and got immediately stuck! Soon I found the problem in the
source code but no way to connect to the board anymore in order to flash
the corrected code...
Googling brought me soon to this and the related threads and this was most
helpful to understand the situation of having an either bricked MCU or a
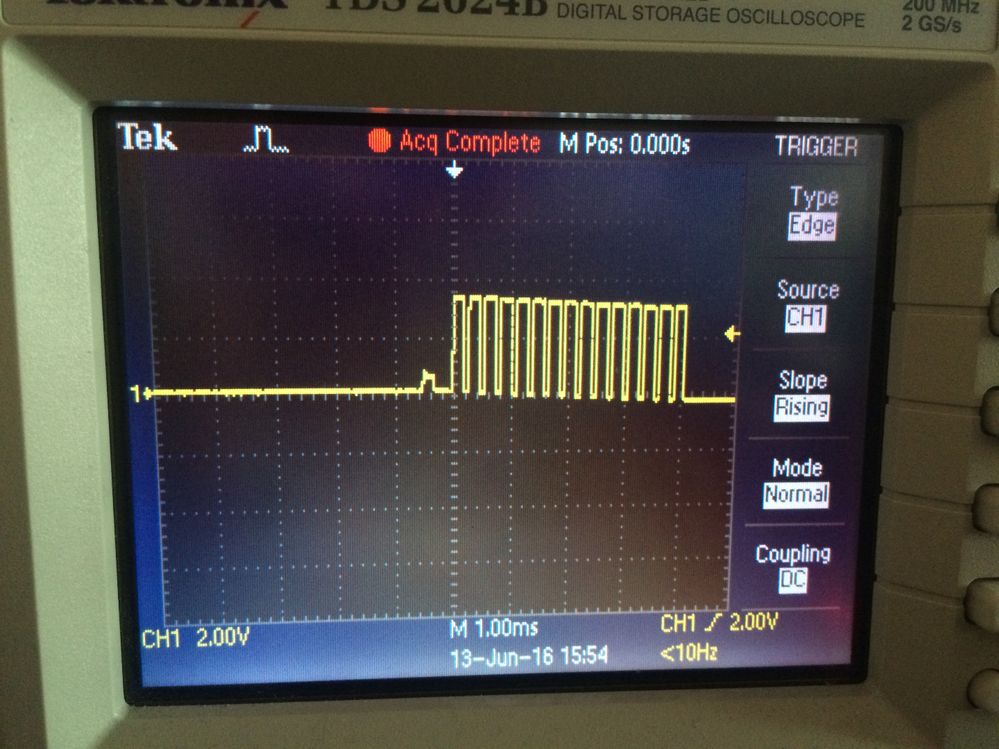
destructive reset after reset escalation. Using my scope I could prove
within a few minutes that I was in the lucky latter situation. However,
how to recover from that situation? The threads gave the right hints but I didn't
find a to-the-point recipe what to do concretely. Here, I want to fill this gap.
The DEVKIT has an on board JTAG debugger, which is not capable to connect
to the MCU any more ("Cannot put the MCU into background mode" or
similar). The explanations given in these threads make it probable that
the connection has to happen before we reach the destructive reset, i.e.
after power on and during reset escalation. This is a time span of about
300ms.
On the DEVKIT the debugger is normally turned on together with the MCU.
And it's simply impossible to first startup the debugger and then issue the
connect to target commands within 300ms. Once the debugger is ready to
operate the MCU is again in its destructive reset.
I connected a P&E Multilink Interface to the DEVKIT's JTAG connector. This
decouples debugger startup and powering the MCU.
Connecting the P&E Multilink Interface: The colored wire in the JTAG
ribbon cable belongs to pin 1 on the PCB; a small "1" is printed on the
PCB close to the connector. It doesn't matter that we have two P&E USB
debuggers connected simultaneously to PC: The command line of the debugger
server will address to the right one.
Next problem: At the beginning I had mainly used the debugger through the
S32DS Eclipse interface. This means a strong delay between clicking the
debug button and the debugger making the connection to the target. All of this
takes much more than 300ms. Maybe it would be possible to first start the
debugger, count till three and then power on the MCU, but one would be very
lucky to succeed using this weak timing strategy.
Therefore I decided to use the debugger on the command line. Starting the
server involves an immediate attempt to connect to the target. The
strategy: Type the command line and hold your finger above the enter key.
Then plug-in the USB wire to the DEVKIT at the same time you release your
finger.
Already in my second attempt the technique succeeded and I got connected
to the board.
Many people may have bought their DEVKIT because of it's amazing
attractive price and they won't have bought an additional Multilink
debugger, which costs much more on its own then the entire DEVKIT including
the debugger. Next step was to find out how the same can be achieved with
the on-board debugger.
A view at the schematics revealed that powering of the debugger and of the
MCU is indeed decoupled though the jumper to select either USB or external
12V powering. Two possible strategies:
1) Jumper and connect the external 12V supply via a switch (switch is off),
plug in the DEVKIT, enter the start server command line (finger still above
enter key), then switch 12V supply on and hit the enter key at the same time.
2) The jumper for selecting the power supply for the MCU can be abused as
switch to power the MCU on or off: If it is detached the MCU is unpowered
(but the debugger still is through USB), if it is attached in position
select-USB-power then the MCU is powered. Strategy 2) is identical to 1)
except for not switching the external 12V supply but using the jumper as
MCU power switch.
I tried 2), and since handling the jumper as switch is a bit tricky it
took me this time five or six attempts to get the connection. But still an
acceptable way of doing.
Now we have the debugger connected to the MCU but the SW fault leading to
the reset escalation is not fixed. We can first use the debugger to
identify the problem but eventual we need to use it to flash a corrected piece
of software. Getting here you should have a proven *.elf file at hand,
take any previously compiled, still success build. There are two ways to
flash this binary and/or step through the still flashed, faulty software:
1) In S32DS, duplicate and modify your Debug Configuration normally used
for flashing. By default, the debug configurations start the debugger
server every time you click on debug. Our server is already started and we
need to modify the configuration such that it not starts a server and
connects (through a TCP/IP socket) to our already started server.
2) Open a new shell window and start the debugger client from the command
line. Issue the debugger commands to start the software, step through it
and finally the flash command to replace it with the proven, well
working binary you have at hand.
I only tried 2) but 1) is likely straightforward, too, as the S32DS GUI exposes
the according elements to click.
After flashing the proven binary the board is back in the normal state.
The debug server can be disconnected and stopped, and the S32DS can be
applied as normally.
Here are the command lines, you need to perform the steps of the recipe.
(<installDir> is the root directory of your S32DS installation, the
folder, where Cross_Tools, Drivers, eclipse and more can be found in):
1) Command line to start the debugger server if the P&E Multilink debugger
is used:
<installDir>\eclipse\plugins\com.pemicro.debug.gdbjtag.ppc_1.7.2.201709281658\win32\pegdbserver_power_console.exe -device=MPC5748g -startserver -serverport=7224 -gdbmport=6224 -interface=USBMULTILINK -speed=5000 -port=USB1 -verbose
2) Command line to start the debugger server if the built-in openSDA debugger
is used:
<installDir>\eclipse\plugins\com.pemicro.debug.gdbjtag.ppc_1.7.2.201709281658\win32\pegdbserver_power_console.exe -device=MPC5748g -startserver -serverport=7224 -gdbmport=6224 -interface=OPENSDA -speed=5000 -port=USB1 -verbose
3) Command line to start the debugger client from another shell window:
<installDir>\Cross_Tools\powerpc-eabivle-4_9\bin\powerpc-eabivle-gdb.exe
The following commands are submitted from the command line of the debugger
client after the debugger server was successfully started and got the
connection to the board and after the debugger client has been started:
4) Connect the client to the debugger server:
target remote localhost:7224
5) Commands to initialize the debug session. (These commands have been taken
from the console window of the S32DS debug session. I don't know whether
or to which extend they are essential):
set mem inaccessible-by-default off
set tcp auto-retry on
set tcp connect-timeout 240
set remotetimeout 60
monitor preserve1 0
monitor preserve2 0
6) If you want to step through the buggy, still flashed code then you need
to load the related *.elf file to have the symbols and references to the
source code. Note Windows users, <pathToElfFile> uses either slashes or
double backslashes:
symbol-file <pathToElfFile>
Use commands like
help,
disass $pc,+100 (dissamble),
l (list source code),
p (print)
b (set breakpoint),
n (next instruction),
s (step),
u (until line),
c (continue),
etc.
to debug your code. Be careful, don't get stuck again at your SW bug, it's
still there.
7) Flash the other, proven binary:
load <pathToProvenElfFile>
8) End the session:
detach
q
Note q will end the client. The server in the other shell window can be
stopped with Ctrl-C. The connection to the hardware is lost and the board
should be fine again. Good luck!
Hello Peter,
Thanks very much for you solution!!
It's very very useful, many people meet this problem and don't know how to solve it. I think they can bring devkit-board back to life now!! :smileyhappy:
Hello,
yes, it seems so. Sad.
Is it related to pemicro plugins or drivers and s32ds? I cannot recreate the problem, can you describe your situation how it ended up like this?
Hi,
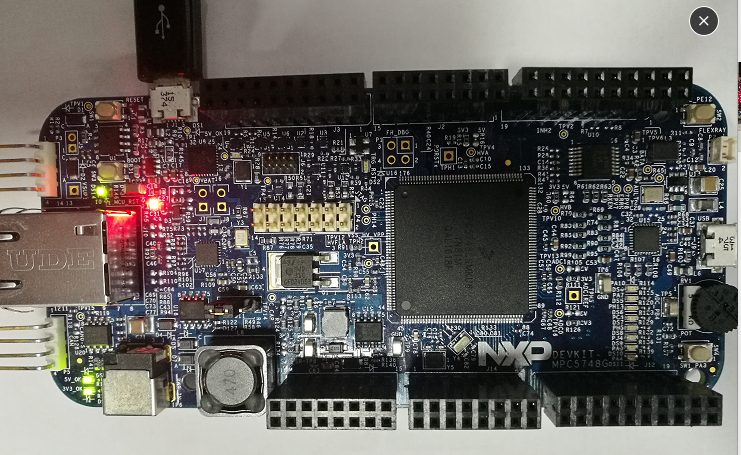
same issue arrrrg! Is that a reset escalation on MPC5748G devkit? (see screenshot + red light is perm ON)
Disappointing if this means silicon heaven! I'm using latest S32DS with with updates, should include the fix that was proposed in https://community.nxp.com/thread/444748?commentID=877631#comment-877631 by .
Nothing I can do about it? Could you ship me a new one..............please?
Regards
Hello,
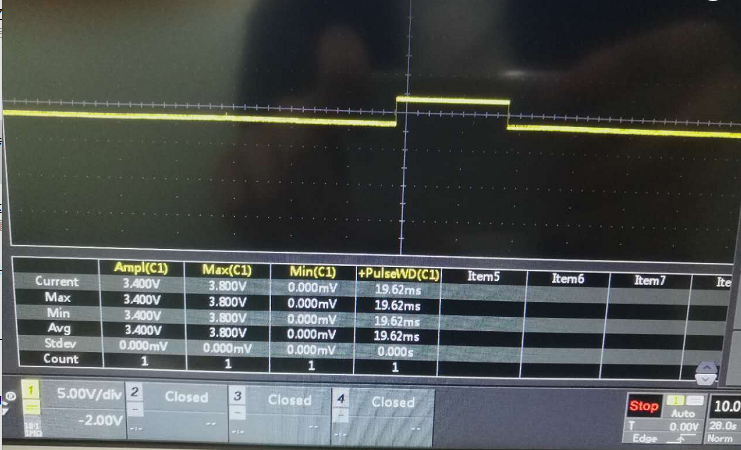
I am not sure about the first figure. Is this reset line of working microcontroller? What time base have you set? How long is the pulse?
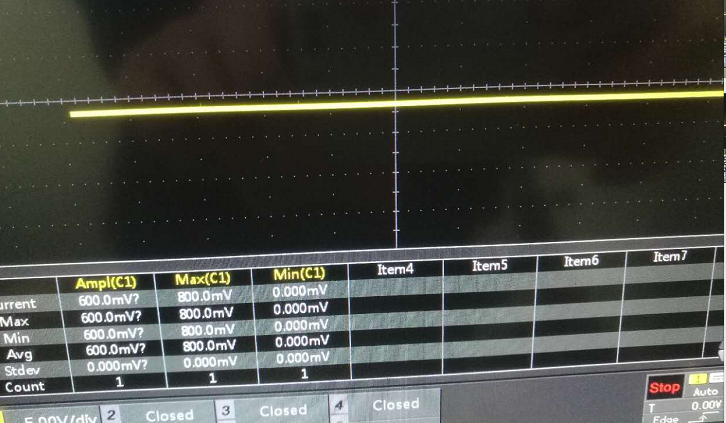
About second figure, if this is signal triggered after power on reset, your microcontroller is "dead".
Regards,
Martin
Hello Kuang,
the only know issue we already know is described in the thread I posted above
https://community.nxp.com/message/877631?commentID=877631#comment-877631
It is problem regarding HSM and double bit ECC error in HSM memory area. Customer should avoid reset or power supply failure during the flash is erasing or programming. Please read the comment from Lukas Zadrapa.
If you have any other questions, please feel free to write me back.
Regards,
Martin
Hello,
after power on reset, what signal do you see on reset line?
Is there reset escalation?
Or you see reset line still in logic 0?
If reset line is still in logic 0 (you do not see reset escalation), could you please read thread below and let me know, if it could be applicable to your issue?
https://community.nxp.com/message/877631?commentID=877631#comment-877631
If you have any other questions, please feel free to write me back.
Regards,
Martin
I encountered that the RST power-on signal of MPC5748G is the same as the signal displayed by the oscilloscope above, how can I solve it?


