- Forums
- Product Forums
- General Purpose MicrocontrollersGeneral Purpose Microcontrollers
- i.MX Forumsi.MX Forums
- QorIQ Processing PlatformsQorIQ Processing Platforms
- Identification and SecurityIdentification and Security
- Power ManagementPower Management
- Wireless ConnectivityWireless Connectivity
- RFID / NFCRFID / NFC
- Advanced AnalogAdvanced Analog
- MCX Microcontrollers
- S32G
- S32K
- S32V
- MPC5xxx
- Other NXP Products
- S12 / MagniV Microcontrollers
- Powertrain and Electrification Analog Drivers
- Sensors
- Vybrid Processors
- Digital Signal Controllers
- 8-bit Microcontrollers
- ColdFire/68K Microcontrollers and Processors
- PowerQUICC Processors
- OSBDM and TBDML
- S32M
- S32Z/E
-
- Solution Forums
- Software Forums
- MCUXpresso Software and ToolsMCUXpresso Software and Tools
- CodeWarriorCodeWarrior
- MQX Software SolutionsMQX Software Solutions
- Model-Based Design Toolbox (MBDT)Model-Based Design Toolbox (MBDT)
- FreeMASTER
- eIQ Machine Learning Software
- Embedded Software and Tools Clinic
- S32 SDK
- S32 Design Studio
- GUI Guider
- Zephyr Project
- Voice Technology
- Application Software Packs
- Secure Provisioning SDK (SPSDK)
- Processor Expert Software
- Generative AI & LLMs
-
- Topics
- Mobile Robotics - Drones and RoversMobile Robotics - Drones and Rovers
- NXP Training ContentNXP Training Content
- University ProgramsUniversity Programs
- Rapid IoT
- NXP Designs
- SafeAssure-Community
- OSS Security & Maintenance
- Using Our Community
-
- Cloud Lab Forums
-
- Knowledge Bases
- ARM Microcontrollers
- i.MX Processors
- Identification and Security
- Model-Based Design Toolbox (MBDT)
- QorIQ Processing Platforms
- S32 Automotive Processing Platform
- Wireless Connectivity
- CodeWarrior
- MCUXpresso Suite of Software and Tools
- MQX Software Solutions
- RFID / NFC
- Advanced Analog
-
- NXP Tech Blogs
- Home
- :
- MCUXpressoソフトウェアとツール
- :
- MCUXpresso IDE
- :
- Unknown gdb command exec-run?
Unknown gdb command exec-run?
- RSS フィードを購読する
- トピックを新着としてマーク
- トピックを既読としてマーク
- このトピックを現在のユーザーにフロートします
- ブックマーク
- 購読
- ミュート
- 印刷用ページ
- 新着としてマーク
- ブックマーク
- 購読
- ミュート
- RSS フィードを購読する
- ハイライト
- 印刷
- 不適切なコンテンツを報告
Debugging the hello world example from MCUXpresso IDE using a JLinkPro debugger gives the error "Failed to execute MI Command" "exec-run" "Don't know how to run." How can I fix this to enable debugging?
This is using the SDK_2.x_FRDM-K82F kit at Version 2.6.0 built for MCUXpressoIDE toolchain.
In the GDB trace log I can see it looks like the exec-run command was unknown. I've included this and other logs in the attached file but the relevant contents are:
929,408 (gdb)
929,409 38-exec-run --thread-group i1
929,409 38^error,msg="Don't know how to run. Try \"help target\"."
929,410 (gdb)
929,414 39-gdb-exit
929,414 39^exit
929,414 =thread-group-exited,id="i1"
(UPDATE: The error is the same regardless if using a JLinkPro via USB, JLinkPro via Ethernet or onboard the OpenSDA debugger.)
(UPDATE: We see the same error with both Windows and Linux hosts using MCUXpresso IDE v11.0.0 build 2516.)
It seems to me the GDB commands MCUXpresso is trying to use are incompatible with the SDK but everything is at the latest so unsure why this would be or if I have some miss-configuration I'm aware of. Any help would be appreciated!
解決済! 解決策の投稿を見る。
- 新着としてマーク
- ブックマーク
- 購読
- ミュート
- RSS フィードを購読する
- ハイライト
- 印刷
- 不適切なコンテンツを報告
How did you create the Lauch configuration? Did you press the *blue* debug button, or something else?
- 新着としてマーク
- ブックマーク
- 購読
- ミュート
- RSS フィードを購読する
- ハイライト
- 印刷
- 不適切なコンテンツを報告
Ben,
My apologies, yesterday while looking at this issue my access to boards was restricted and I tested with a similar board but subtly different - where OpenSDA and target MCU USB connections were alternately arranged.
That being said, I have now located a Kinetis KL28 and added a debug header for the target MCU for external debug operations. Again, I can see no issue debugging with JLink via USB or IP.
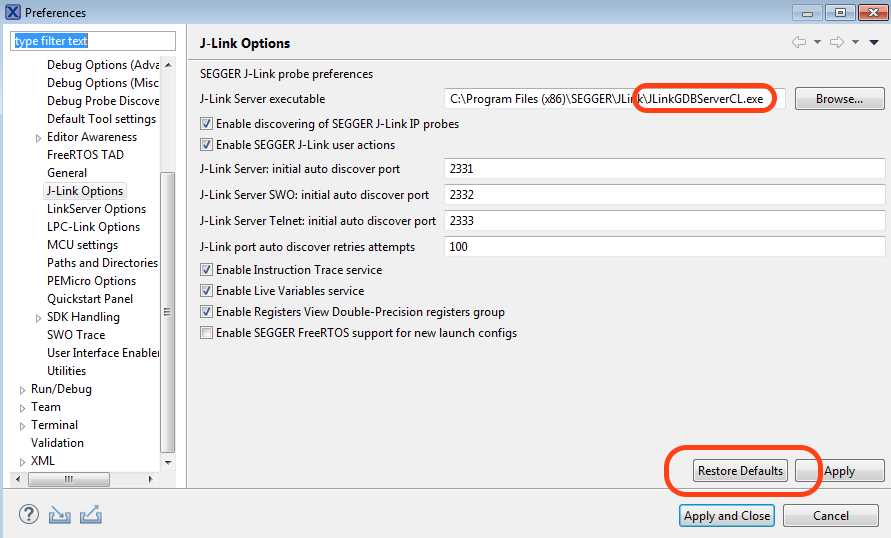
An MCUXpresso IDE installer includes a particular version of JLink and will install this at the IDE installation time. However, no JLink version assumption is made until the first workspace is created. At this time a search is performed to locate the most recent JLink installation and the path used can be seen within the IDE preferences.
From here, the user has the potential to override the IDE's selection or force the IDE to perform a new search (and path update) via the 'Restore Defaults' button.
But note - the target is the J-Link GDB server not JLlink.exe
For a typical IDE installation - all of this is automatically performed, the only time user action is expected is if a later version of SEGGER is manually installed (for some reason) and an existing workspace remains in use.
Also note: Just to add to the complication... After the release of MCUXpresso IDE version 11.0.0. SEGGER made a change to their long standing installation scheme. Therefore if a version of SEGGER JLink is installed that is more recent than the version installed with MCUXpresso IDE Version 11.0.0 the Restore Default mechanism will not automatically detect this update - instead the user must browse for the newer JLinkGDBServer... Furthermore, if a user uninstalls the version of SEGGER J-Link installed by the IDE and replaces this with a later version, then no JLink support will be found - for each workspace, the new server must be manually selected. This issue will be addressed on the next release of MCUXpresso IDE.
I hope this helps,
Yours,
MCUXpresso IDE Support
- 新着としてマーク
- ブックマーク
- 購読
- ミュート
- RSS フィードを購読する
- ハイライト
- 印刷
- 不適切なコンテンツを報告
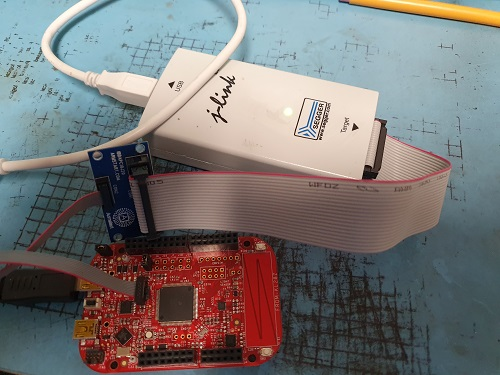
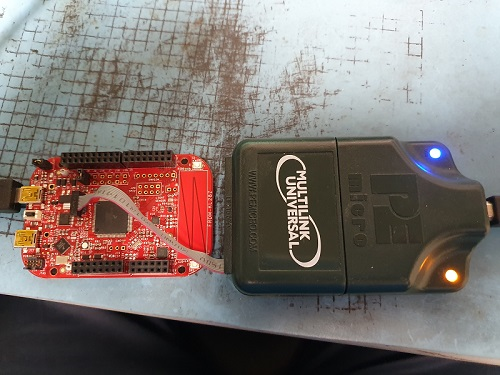
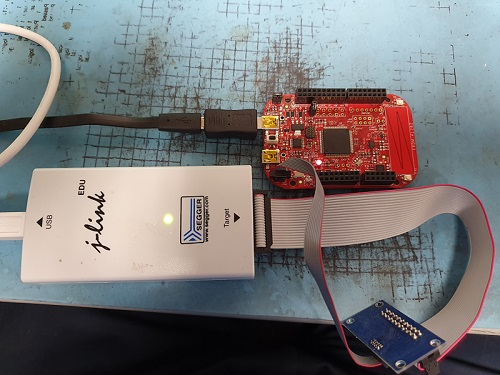
The Jlink is being powered by the target processors USB connector
To get the Jlink Segger target probe to work I have tried:
Un-installing, then re-installing MCUXpressoIDE_11.0.0_2516.exe
tried
1. JLink_Windows_V647d.exe
2. JLink_Windows_V612.exe
3. JLink_Windows_V646h.exe
When I reinstalled MCUXpressoIDE_11.0.0_2516.exe, it uses version:
JLink_Windows_V6.44i
When it installs, it creates the Jlink folder here:
C:\Program Files (x86)\SEGGER\JLink_V644i
But the IDE looks for it here:
C:\Program Files (x86)\SEGGER\JLink
So I moved all the files from the C:\Program Files (x86)\SEGGER\JLink_V644i folder to the C:\Program Files (x86)\SEGGER\JLink folder.
The Console Tab:
[03-7-2019 01:07:28] Executing Server: "C:\Program Files (x86)\SEGGER\JLink\JLink.exe" -nosilent -swoport 2332 -select USB -telnetport 2333 -singlerun -endian little -noir -speed auto -port 2331 -vd -device MKL28Z512xxx7 -if SWD -halt -reportuseraction
SEGGER J-Link Commander V6.44i (Compiled May 17 2019 17:35:18)
DLL version V6.44i, compiled May 17 2019 17:34:22
Unknown command line option -nosilent.
Server has been shut down.
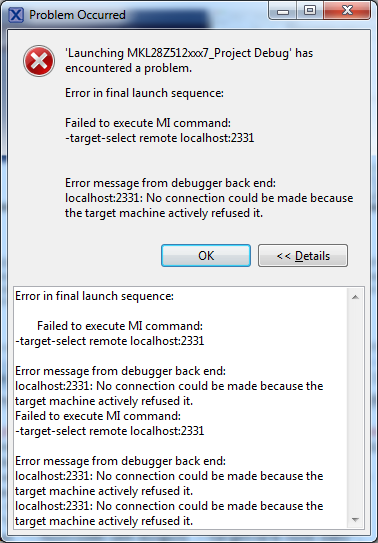
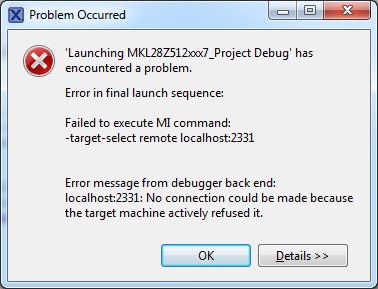
The windows message box:
As I mentioned, powering the FRDM-KNL28Z from the target USB and using the PEMico's Multilink Probe,
the project can be debugged.
- 新着としてマーク
- ブックマーク
- 購読
- ミュート
- RSS フィードを購読する
- ハイライト
- 印刷
- 不適切なコンテンツを報告
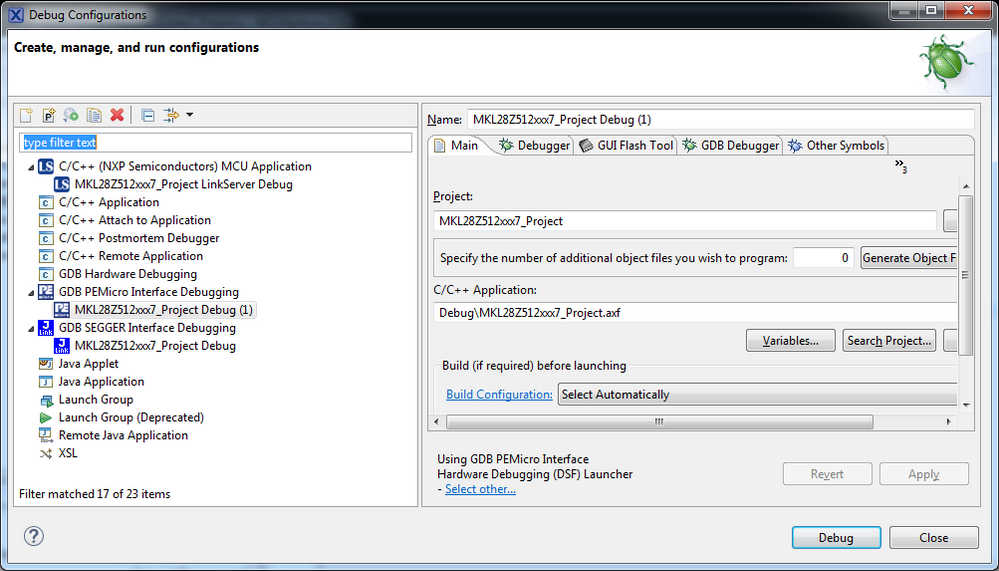
Noticed the SDA USB uses LinkServerDebug
The SWD Segger 10pin Debugger uses Jlink GDB SEGGER Interface Debugging
When I added the Segger Jlink debug, I get:
When I added the PEMicro:
The project does erase, download,verify and allows stepping with the MKL28Z512 10 pin debug. I have FINALLY found a probe that can function.
- 新着としてマーク
- ブックマーク
- 購読
- ミュート
- RSS フィードを購読する
- ハイライト
- 印刷
- 不適切なコンテンツを報告
Hi Ben,
It looks like you have had a fairly rough time getting debug working. As I am sure you have heard many times - this should just work either using MCUXpresso IDE version 10.3.1 or v 11.1.0.
From your pictures I see you are powering the board from the OpenSDA USB connection. This is fine (essential) for OpenSDA debug but not for debug via external probes.
I am able to duplicate your debug problem when powering from the OpenSDA USB and debugging with SEGGER.
Please try powering the board from the target device USB connection i.e. the lower one when using SEGGER JLink or P&E.
Yours,
MCUXpresso IDE Support
- 新着としてマーク
- ブックマーク
- 購読
- ミュート
- RSS フィードを購読する
- ハイライト
- 印刷
- 不適切なコンテンツを報告
Bad news is that MCUexpresso cannot talk to the target MKL28Z512 processor using the Segger probe connected to the target micro's 10 pin debug connector. MCUexpresso can talk to the SDA USB port.
I don't think my company would want to add a MK20DX128 microprocessor to each unit, just to program the MKL28Z.
The Segger probe did work in flashing the MK20DX128 though its 10 pin debug connector.
- 新着としてマーク
- ブックマーク
- 購読
- ミュート
- RSS フィードを購読する
- ハイライト
- 印刷
- 不適切なコンテンツを報告
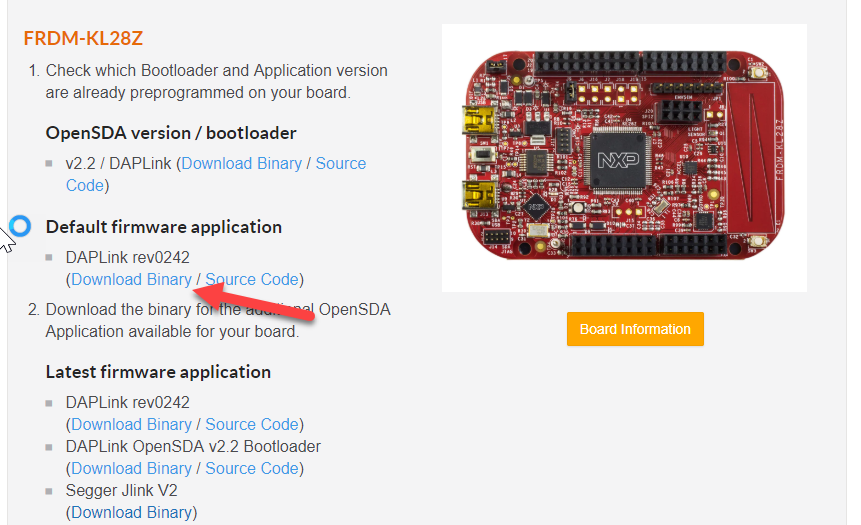
After dropping k20dx_frdmkl28z_if_crc.bin found in "OpenSDAv2.2_DAPLink_frdmkl28z_rev0242.zip"
My FRDM-MKL28Z project did download using USB SDA, and as a bonus... stopped at main... and as a super bonus, can single step.
Magic combination sauce:
1. MSD bootloader "0244_k20dx_bootloader_update_0x8000.bin" found DAPLink bootloader update | Mbed
2. SDA bootloader "k20dx_frdmkl28z_if_crc.bin" found in "OpenSDAv2.2_DAPLink_frdmkl28z_rev0242.zip"
3. J-link version "JLink_Windows_V647d.exe" found SEGGER - The Embedded Experts - Downloads - J-Link / J-Trace
4. MCUexpresso "MCUXpressoIDE_11.0.0_2516.exe"
Regards,
Ben
- 新着としてマーク
- ブックマーク
- 購読
- ミュート
- RSS フィードを購読する
- ハイライト
- 印刷
- 不適切なコンテンツを報告
No blue button, when I press Debug in the Quickstart panel I get:
- 新着としてマーク
- ブックマーク
- 購読
- ミュート
- RSS フィードを購読する
- ハイライト
- 印刷
- 不適切なコンテンツを報告
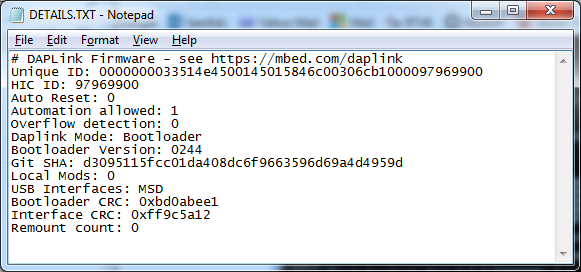
Now at version 2.44
Found "0244_k20dx_bootloader_update_0x8000.bin" binary at:
DAPLink bootloader update | Mbed
After copying the binary into the folder, Had to loadbin with 0x8000 offset:
J-Link>loadbin C:\Users\bmccormick\Downloads\OpenSDAv2.2_DAPLink_frdmkl26z_rev0242\0244_k20dx_bootloader_update_0x8000.bin,0x8000
Now after a reset, reboot:
Now to try the blue button.
- 新着としてマーク
- ブックマーク
- 購読
- ミュート
- RSS フィードを購読する
- ハイライト
- 印刷
- 不適切なコンテンツを報告
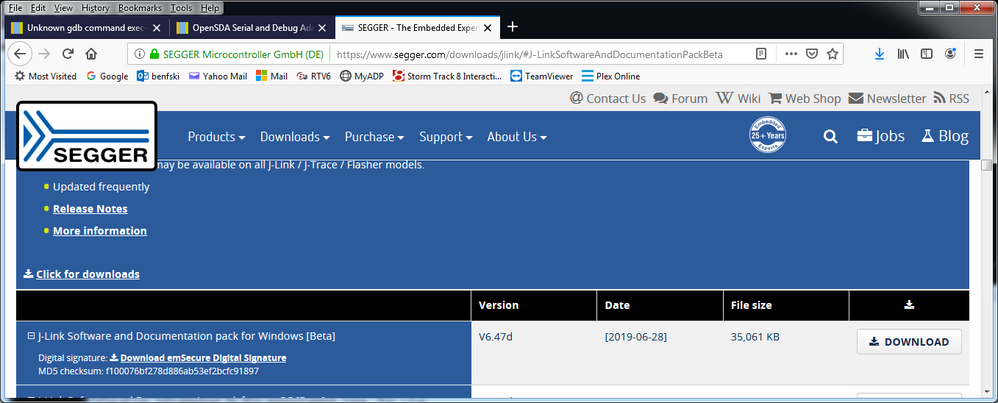
Noticed that your Jlink.exe was at V647a, I used V6.12. Couldn't find V647a, but did find V647d, no legacy selection in the Beta.
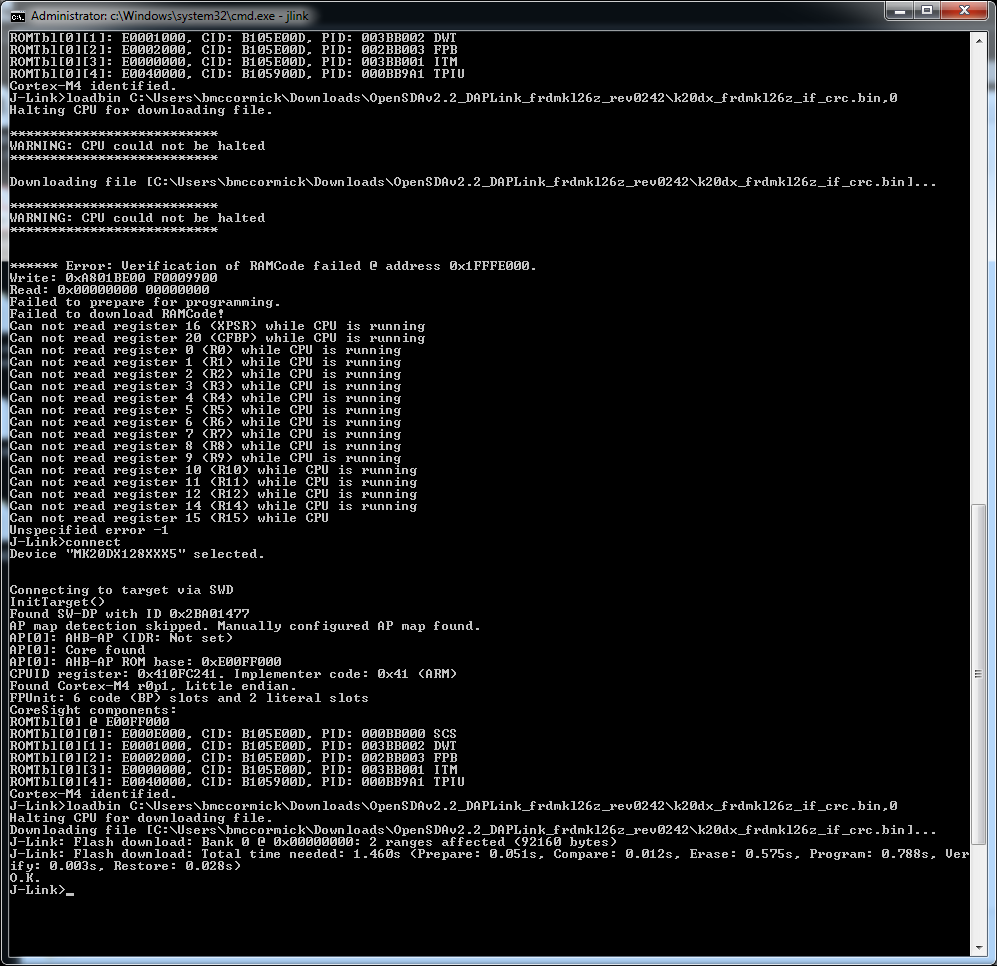
When first connecting with V647d, couldn't connect, tried powering up on the target USB port, couldn't halt CPU, then powered back up on SDA USB, looks like it did download the bin file:
Yet another brain fade. I noticed that the link to the bootloader actually was to the FRDM-KL26 NOT FRDM-KL28Z,
so needless to say, it doesn't bootup when the reset button is held and released. I guess its time to go home now.
- 新着としてマーク
- ブックマーク
- 購読
- ミュート
- RSS フィードを購読する
- ハイライト
- 印刷
- 不適切なコンテンツを報告
After noticing the USB was on the SDA port and mine wasn't, after switching to the SDA port, here was the loadbin results:
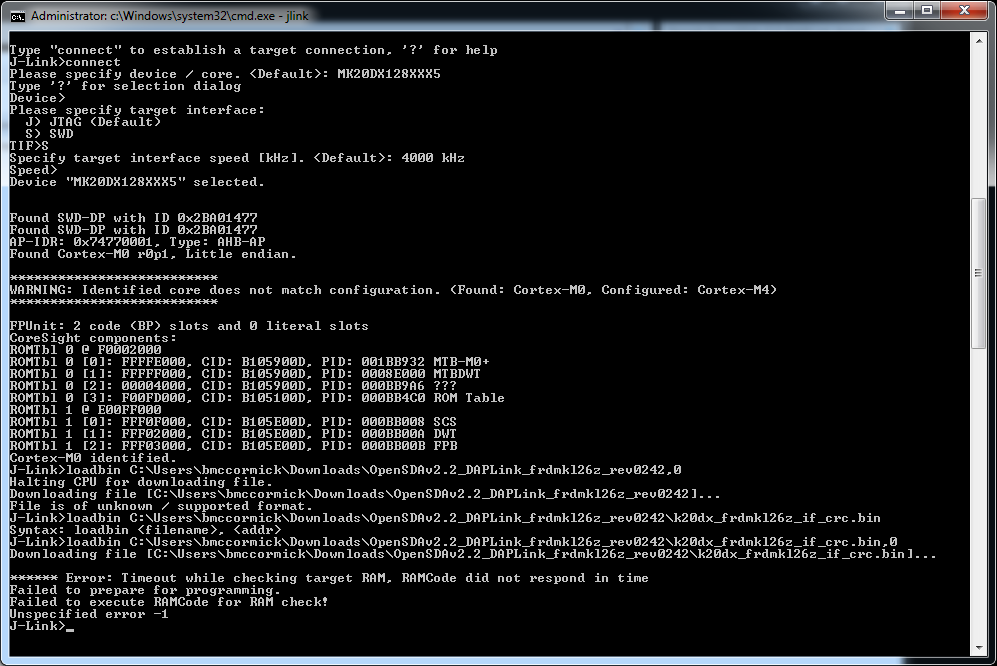
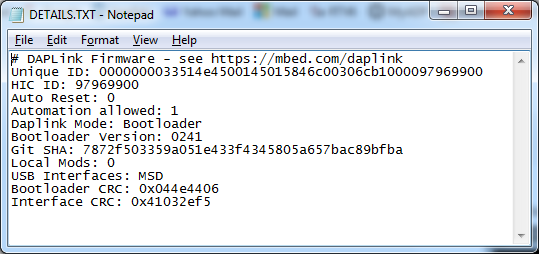
Looks like the download did fail, still at version 2.41
- 新着としてマーク
- ブックマーク
- 購読
- ミュート
- RSS フィードを購読する
- ハイライト
- 印刷
- 不適切なコンテンツを報告
Thanks Alexis for the detailed example.
The link to https://www.nxp.com/downloads/en/snippets-boot-code-headers-monitors/OpenSDAv2.2_DAPLink_frdmkl28z_r...
took me to:
Page Not Found
The page you requested cannot be found.
After Googling "OpenSDAv2.2_DAPLink_frdmkl26z_rev0242.zip" I found where to download it at:
DAPLink downloads missing from site
Running Jlink:
Augggh.
- 新着としてマーク
- ブックマーク
- 購読
- ミュート
- RSS フィードを購読する
- ハイライト
- 印刷
- 不適切なコンテンツを報告
Its gotten worse now and not better. I've uninstalled MCUXpressoIDE_11.0.0_2516.exe, then installed MCUXpressoIDE_10.3.1_2233.exe.
I read in a previous thread someone said 10.3.1 used to work. It didn't.
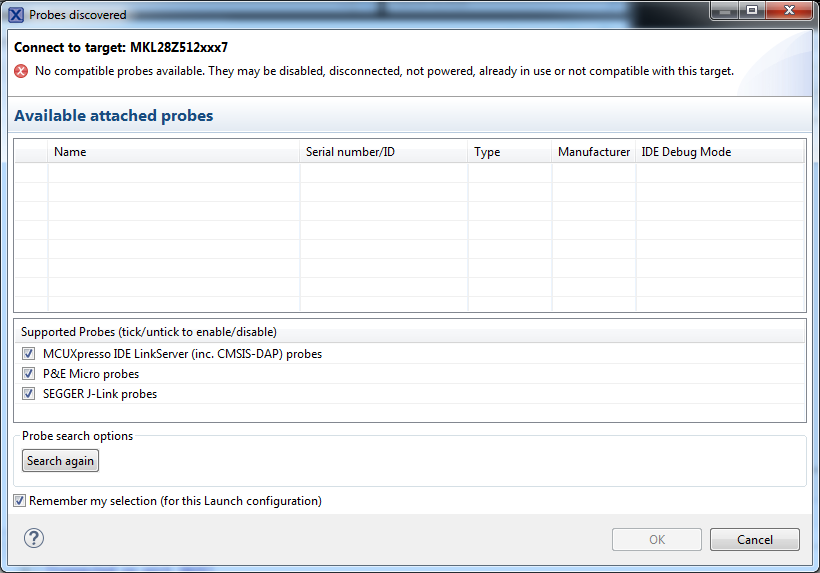
Then I went back to 11.0.0 and now when I press Debug in the in the Quickstart Panel, no probe is found.
I have tried:
OpenSDA 2.2 Daplink BOOTLOADER for K20DX.bin
OpenSDA 2.2 Daplink BOOTLOADER for K20DX_rev0241.bin
OpenSDA_V2_1.bin
OpenSDA_V3_2.bin
with:
JLink_Windows_V647d.exe
JLink_Windows_V647h.exe
JLink_Windows_V647g.exe
JLink_Windows_V647b.exe
JLink_Windows_V612.exe
I'm seriously considering dropping my choice of the KLM28Z processor for this project. Drafting is waiting for my schematic
and I can't even connect to the debug port.
I have tried the PE Multilink RevB and RevC debugger and neither of those work either in either the 10pin or SDA mode.
I have tried the Segger EDU J-Link probe connected to the 10-pin debug port and it also fails.
- 新着としてマーク
- ブックマーク
- 購読
- ミュート
- RSS フィードを購読する
- ハイライト
- 印刷
- 不適切なコンテンツを報告
Hi Ben,
Can you try using this file to load this file using the external debugger?
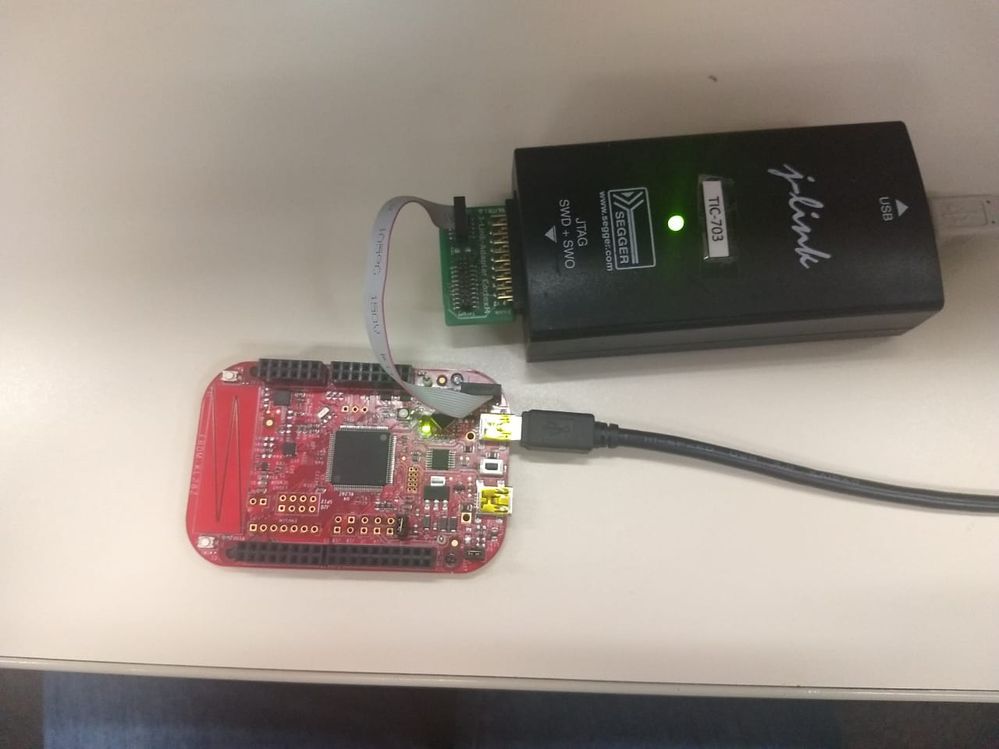
Using the J-Link debugger connected to the SWD 10-pin connector near the OpenSDA connector, this will give you access to the MK20 in the board.
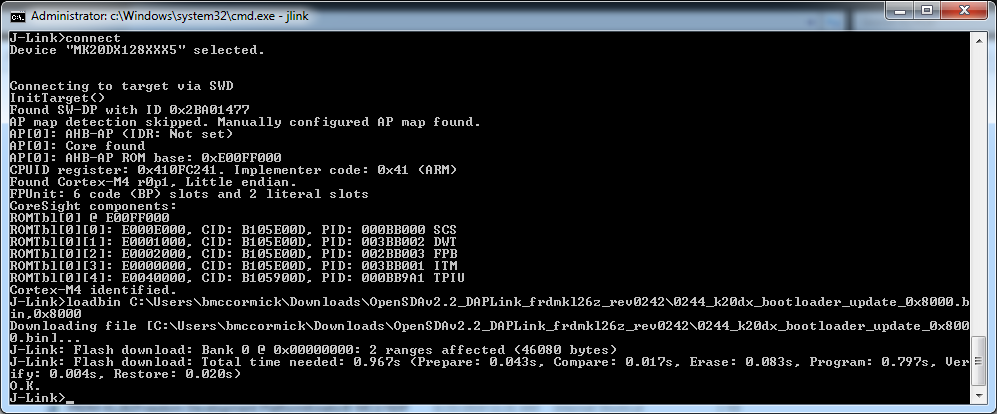
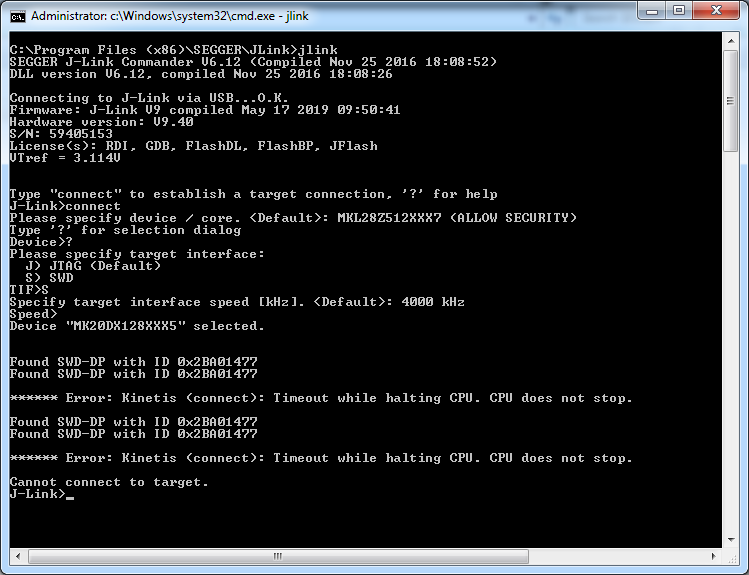
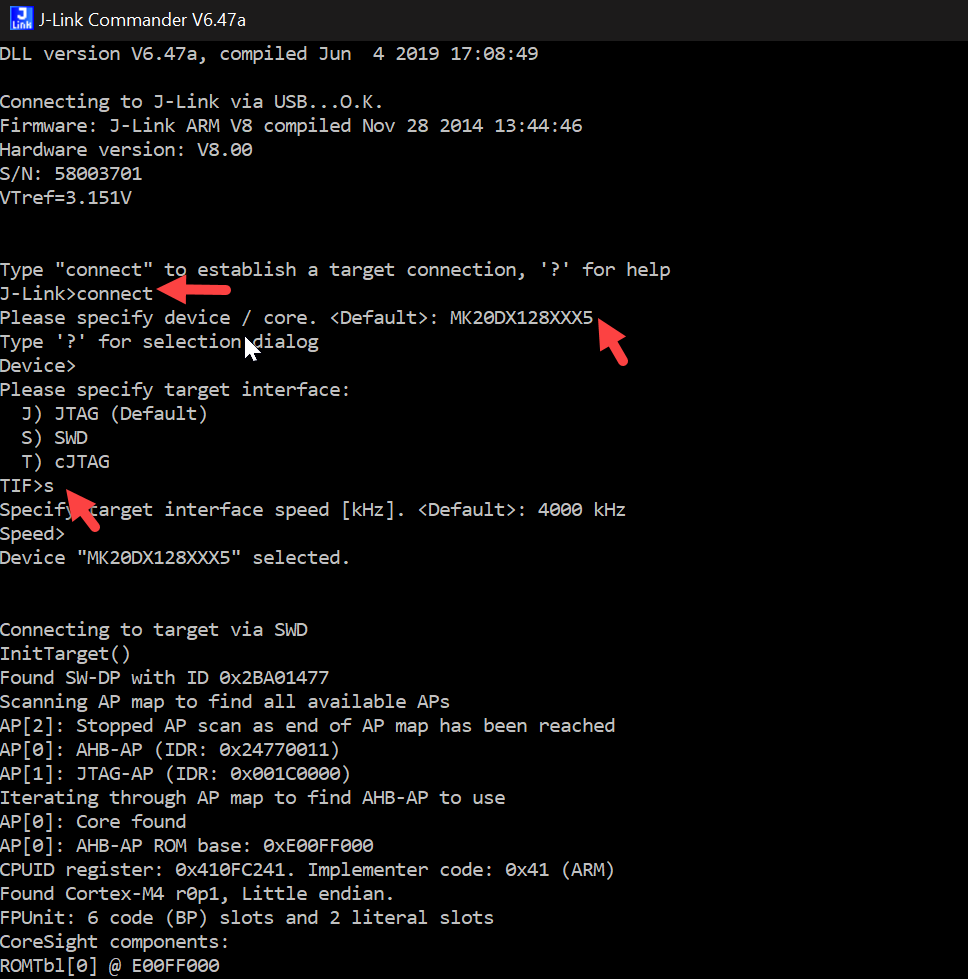
Using the J-Link commander console execute the next commands:
- connect
-? (Search for the MK20Dx128XXX5)
-s (select SWD)
-(Enter) (Default)
The log should be like the next one:
Then to download the OpenSDA use the command loadbin:
-loadbin (path), 0
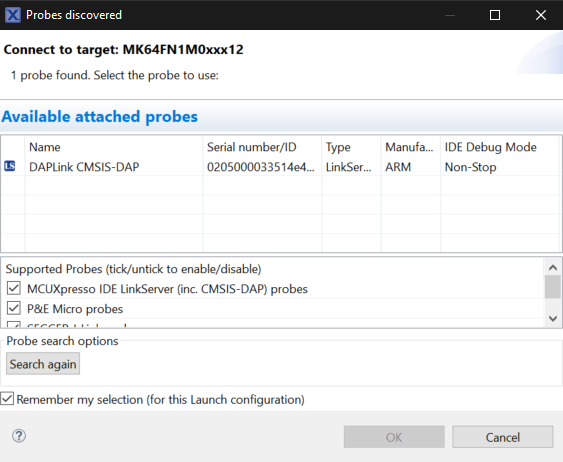
And the MCUXpresso should recognize the device after clicking the blue bug, as the next image:
In case you want to debug the target MCU (KL28Z), you should connect the debugger to the other SWD 10 pin connector.
Let me know if this helps you.
Best Regards,
Alexis Andalon
- 新着としてマーク
- ブックマーク
- 購読
- ミュート
- RSS フィードを購読する
- ハイライト
- 印刷
- 不適切なコンテンツを報告
I have the same problem "Failed to execute MI command", using MCUXpressoIDE_11.0.0_2516.exe with
JLink_Windows_V647d.exe or
JLink_Windows_V646h.exe or
JLink_Windows_V646g.exe
Target is FRDM-KLM28Z SDA
The same thing happens using the Segger Jlink probe and the 10 pin debug connector.
The blinky program runs, the LED is flashing, but the debugger is having problems after the erase. flash, verify cycle.
- 新着としてマーク
- ブックマーク
- 購読
- ミュート
- RSS フィードを購読する
- ハイライト
- 印刷
- 不適切なコンテンツを報告
Have you tried deleting all existing debug configurations then creating a new one from scratch using the blue debug button?
It seems the blue debug button places some additional critical configuration setting in the launch file if created from scratch. The green debug button "Debug Configuration" does not do this but can be used to edit a configuration (which was created via the blue button).
I *think* the critical configuration entry the blue button adds is...
<stringAttribute key="org.eclipse.cdt.launch.PROJECT_BUILD_CONFIG_ID_ATTR" value="com.crt.advproject.config.exe.debug.1497756402"/
...located in the "<project> JLink Debug.launch" file under the project folder. Or located under the .metadata folder if you haven't launched the configuration yet.
Note, you can browse through the console's "Display Selected Console" to see the actual GDB spam to confirm your "Failed to execute MI Command" failed on the same command as mine.
- 新着としてマーク
- ブックマーク
- 購読
- ミュート
- RSS フィードを購読する
- ハイライト
- 印刷
- 不適切なコンテンツを報告
On windows the debugger works with MCUXpresso IDE v10.3.1 after clicking on the blue debug button which is using SEGGER JLink v6.42b.
On Linux the debugger also works with MCUXpresso IDE v11 after clicking on the blue debug button which is using SEGGER JLink v6.46g. Note, after I clicked the button a exceptions appeared "Internal: unable to find dfu-util" but clicking okay twice lets the probe discovered via USB.
We are using the JLinkPro via Ethernet so after the configuration was created I edited it to change to Ethernet and everything seems to be working now. Had a few initial deployment issues but eventually worked!
- 新着としてマーク
- ブックマーク
- 購読
- ミュート
- RSS フィードを購読する
- ハイライト
- 印刷
- 不適切なコンテンツを報告
Dear Nathan,
To give you a better support, could you let me know which MCUXpresso version are you using?
Also could you try reinstalling the J-Link drivers in the next path:
C:\nxp\MCUXpressoIDE_11.0.0_2516\Drivers
Best Regards,
Alexis Andalon
- 新着としてマーク
- ブックマーク
- 購読
- ミュート
- RSS フィードを購読する
- ハイライト
- 印刷
- 不適切なコンテンツを報告
I can re-create the problem using a fresh installation of MCUXpresso 11 on Windows. Installing the latest SEGGER "J-Link Software and Documentation" pack removes and adds back the same binaries drivers (same size and date stamp). Even the wizard says nothing needed to be updated.
Re-installing the drivers on my Ubuntu 18.04.2 host show no date or size changes and still produces the problem.
- 新着としてマーク
- ブックマーク
- 購読
- ミュート
- RSS フィードを購読する
- ハイライト
- 印刷
- 不適切なコンテンツを報告
How did you create the Lauch configuration? Did you press the *blue* debug button, or something else?
