- Forums
- Product Forums
- General Purpose MicrocontrollersGeneral Purpose Microcontrollers
- i.MX Forumsi.MX Forums
- QorIQ Processing PlatformsQorIQ Processing Platforms
- Identification and SecurityIdentification and Security
- Power ManagementPower Management
- Wireless ConnectivityWireless Connectivity
- RFID / NFCRFID / NFC
- Advanced AnalogAdvanced Analog
- MCX Microcontrollers
- S32G
- S32K
- S32V
- MPC5xxx
- Other NXP Products
- S12 / MagniV Microcontrollers
- Powertrain and Electrification Analog Drivers
- Sensors
- Vybrid Processors
- Digital Signal Controllers
- 8-bit Microcontrollers
- ColdFire/68K Microcontrollers and Processors
- PowerQUICC Processors
- OSBDM and TBDML
- S32M
- S32Z/E
-
- Solution Forums
- Software Forums
- MCUXpresso Software and ToolsMCUXpresso Software and Tools
- CodeWarriorCodeWarrior
- MQX Software SolutionsMQX Software Solutions
- Model-Based Design Toolbox (MBDT)Model-Based Design Toolbox (MBDT)
- FreeMASTER
- eIQ Machine Learning Software
- Embedded Software and Tools Clinic
- S32 SDK
- S32 Design Studio
- GUI Guider
- Zephyr Project
- Voice Technology
- Application Software Packs
- Secure Provisioning SDK (SPSDK)
- Processor Expert Software
- Generative AI & LLMs
-
- Topics
- Mobile Robotics - Drones and RoversMobile Robotics - Drones and Rovers
- NXP Training ContentNXP Training Content
- University ProgramsUniversity Programs
- Rapid IoT
- NXP Designs
- SafeAssure-Community
- OSS Security & Maintenance
- Using Our Community
-
- Cloud Lab Forums
-
- Knowledge Bases
- ARM Microcontrollers
- i.MX Processors
- Identification and Security
- Model-Based Design Toolbox (MBDT)
- QorIQ Processing Platforms
- S32 Automotive Processing Platform
- Wireless Connectivity
- CodeWarrior
- MCUXpresso Suite of Software and Tools
- MQX Software Solutions
- RFID / NFC
- Advanced Analog
-
- NXP Tech Blogs
- Home
- :
- MCUXpresso软件和工具
- :
- LPCXpresso IDE常见问题解答
- :
- How to use Watchpoints
How to use Watchpoints
How to use Watchpoints
Background
Watchpoints are data comparitors within the debug architecture of an MCU and sit close to the processor core. When programmed they will monitor the processor's address lines and other signals for the specific event of interest. This hardware is able to monitor data accesses performed by the CPU and force it to halt when a particular data event occurs. Watchpoints are Breakpoints for Data and are often referred to as Data Breakpoints.
Watchpoints within the LPCXpresso IDE make use of this watchpoint hardware.
The number of watchpoints that can be set varies with the MCU family and implementation. For more information please see the FAQ How many breakpoint or watchpoints can I set.
Watchpoints are a powerful aid to debugging allowing the monitoring of global variables, peripheral accesses, stack depth etc. however their visibility within the LPCXpresso (Eclipse) IDE can lead to them being an underused feature.
Note: Features referenced in this FAQ apply to LPCXpresso IDE version 8.0. Earlier versions of the LPCXpresso IDE may differ from the specifics mentioned below.
Setting a Watchpoint
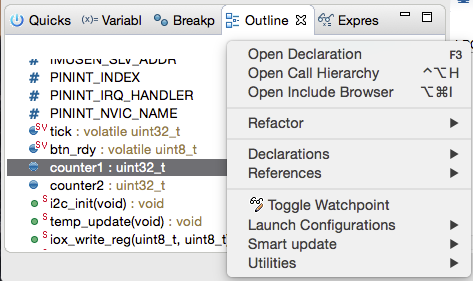
As mentioned previously, the method for setting Watchpoints is rather more hidden within the IDE than some other debugging features. One of the easiest ways to set a Watchpoint is to use the Outline View. By default this will be located within the LPCXpresso IDE Quickstart pane.
From this view you can locate global and static variables then simply select Toggle Watchpoints (or place Breakpoints on functions). Once set, they will appear within the Breakpoint pane alongside any breakpoints that have been set.
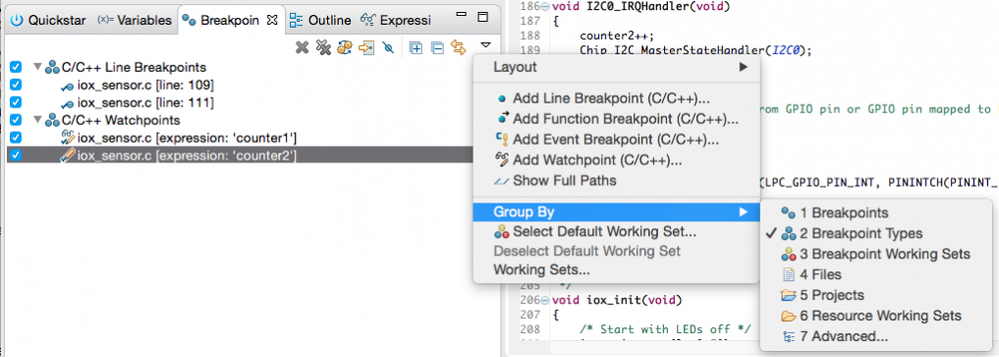
Note: To easily distinguish between Breakpoints and Watchpoints you can choose to group entries by Breakpoint type. From within the Breakpoints view, click the Eclipse Down Arrow Icon Menu, then you can select to Group By Breakpoint Types as shown below:
As you can see from the above graphic, the option to set a Watchpoint is also available from the Breakpoint view. When set from here, you will be offered an unpopulated dialogue - simply entering an address will cause a watchpoint to be created monitoring accesses to that address.
Another place to set Watchpoints within the IDE is from the context sensitive menu within a memory view.
Note: Watchpoint resources are shared with other debug features, in particular an SWO Data Watch item will require a dedicated watchpoint unit to monitor the value.
Using Watchpoints to monitor stack depth
Stacks on ARM based processors use a Full Descending scheme and so have the potential to descend into areas of memory used for other purposes (typically holding global data). Establishing the maximum depth of an applications stack can be a challenge especially since any memory corruption due to excessive stack use may not be immediately apparent. Watchpoints may be used to monitor a fixed depth during program execution to explore the stack depth being reached and then review the area of code that caused the occurrence.
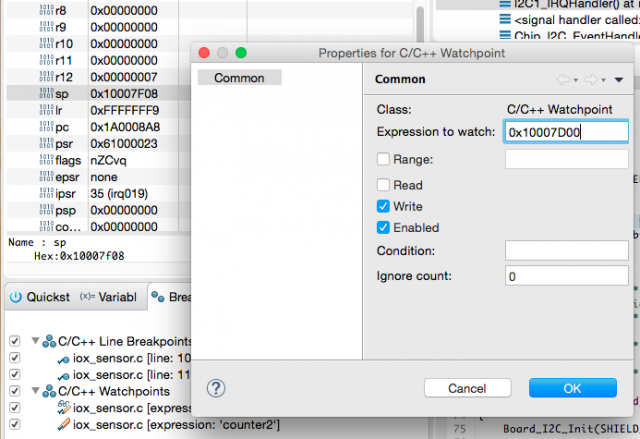
Below an address has been selected to watch for the Stack reaching 0x10007D00.
Watchpoints are a very simply way of monitoring stack depth when an application is running.
Watchpoints can be configured to halt on a Read (or Load), Write (or Store), or both. Since watchpoints 'watch' accesses to memory, they are suitable for tracking accesses to global or static variables, and any data accesses to memory including those to memory mapped peripherals.
Note: Due to the way watchpoints are implemented, any monitored access will be performed by the CPU before a halts occurs (unlike instruction breakpoints - which halt the CPU before the underlying instruction executes). When a watchpoint is hit you will see some 'skid' beyond the instruction that performed the watched data access. If the instruction after the data access changes program flow (e.g. a branch or function return), then the IDE may not show the instruction or statement that caused the CPU to halt.
Note: Application initialisation performed by the C library may write to monitored memory locations, therefore you may see your application halting during startup if watchpoints have been set.


