- Forums
- Product Forums
- General Purpose MicrocontrollersGeneral Purpose Microcontrollers
- i.MX Forumsi.MX Forums
- QorIQ Processing PlatformsQorIQ Processing Platforms
- Identification and SecurityIdentification and Security
- Power ManagementPower Management
- Wireless ConnectivityWireless Connectivity
- RFID / NFCRFID / NFC
- Advanced AnalogAdvanced Analog
- MCX Microcontrollers
- S32G
- S32K
- S32V
- MPC5xxx
- Other NXP Products
- S12 / MagniV Microcontrollers
- Powertrain and Electrification Analog Drivers
- Sensors
- Vybrid Processors
- Digital Signal Controllers
- 8-bit Microcontrollers
- ColdFire/68K Microcontrollers and Processors
- PowerQUICC Processors
- OSBDM and TBDML
- S32M
- S32Z/E
-
- Solution Forums
- Software Forums
- MCUXpresso Software and ToolsMCUXpresso Software and Tools
- CodeWarriorCodeWarrior
- MQX Software SolutionsMQX Software Solutions
- Model-Based Design Toolbox (MBDT)Model-Based Design Toolbox (MBDT)
- FreeMASTER
- eIQ Machine Learning Software
- Embedded Software and Tools Clinic
- S32 SDK
- S32 Design Studio
- GUI Guider
- Zephyr Project
- Voice Technology
- Application Software Packs
- Secure Provisioning SDK (SPSDK)
- Processor Expert Software
- Generative AI & LLMs
-
- Topics
- Mobile Robotics - Drones and RoversMobile Robotics - Drones and Rovers
- NXP Training ContentNXP Training Content
- University ProgramsUniversity Programs
- Rapid IoT
- NXP Designs
- SafeAssure-Community
- OSS Security & Maintenance
- Using Our Community
-
- Cloud Lab Forums
-
- Knowledge Bases
- ARM Microcontrollers
- i.MX Processors
- Identification and Security
- Model-Based Design Toolbox (MBDT)
- QorIQ Processing Platforms
- S32 Automotive Processing Platform
- Wireless Connectivity
- CodeWarrior
- MCUXpresso Suite of Software and Tools
- MQX Software Solutions
- RFID / NFC
- Advanced Analog
-
- NXP Tech Blogs
- Home
- :
- 汎用マイクロコントローラ
- :
- LPCマイクロコントローラ
- :
- Re: How does one debug an Interrupt Handlers without semihosting?
How does one debug an Interrupt Handlers without semihosting?
- RSS フィードを購読する
- トピックを新着としてマーク
- トピックを既読としてマーク
- このトピックを現在のユーザーにフロートします
- ブックマーク
- 購読
- ミュート
- 印刷用ページ
- 新着としてマーク
- ブックマーク
- 購読
- ミュート
- RSS フィードを購読する
- ハイライト
- 印刷
- 不適切なコンテンツを報告
I have been experiencing difficulty stepping through interrupt handlers I have written for SPI, perhaps due to the limitations of Semihosting. I am able to step through my interrupt handler once, but then after that my interrupt handler is mysteriously being called again even after I have disabled interrupts using the code
SPI_DisableInterrupts(SPI9, kSPI_TxLvlIrq | kSPI_RxLvlIrq );
From the MCUXpresso IDE User Guide I understand that there is a way to turn off the Semihosting, but I can’t find the method to do that. I would like to place a counter in my interrupt handler, and after it has been called use a printf to display the number of times the handler has been called. Will someone please tell me how to do that in the MCUXpresso IDE.
I am working with the LPC54018 development board OM4003. I began with the project lpcxpresso54018_spi_interrupt_b2b_master but significantly modified it.
解決済! 解決策の投稿を見る。
- 新着としてマーク
- ブックマーク
- 購読
- ミュート
- RSS フィードを購読する
- ハイライト
- 印刷
- 不適切なコンテンツを報告
Hi,
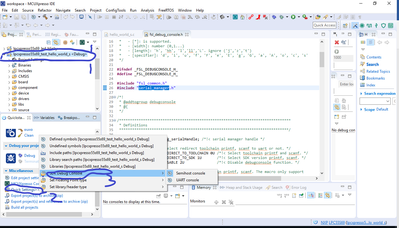
Pls refer to the following screenshot to know the switch between Uart and semihost. The first step is to select the project.
Hope it can help you
BR
XiangJun Rong
- 新着としてマーク
- ブックマーク
- 購読
- ミュート
- RSS フィードを購読する
- ハイライト
- 印刷
- 不適切なコンテンツを報告
That depends on your intentions. With debugging, you mean "wanting to know what happens inside".
For checking the timing, and timing relation to other events/interrupts, you can add instrumentation code to toggle GPIO pins. That helps you visualize the timing, using a scope or logic analyser.
For checking values and states inside the handler, you can store those of one or multiple runs in array, and output them offline later, e.g. via semihosting. That requires instrumentation code as well.
I once worked on a project with a MCU core on an ASIC, were the project manager had decided to go along without debug interface (which turned out more costly later on ...). We used sequential toggles of an available GPIO to output events/state for debugging purposes - again with a scope.
- 新着としてマーク
- ブックマーク
- 購読
- ミュート
- RSS フィードを購読する
- ハイライト
- 印刷
- 不適切なコンテンツを報告
Thank you all for the information you have shared. It all helps. Now can someone now answer my former question as follows?
I already created my project with semihosting. Is there an easy way to convert to UART without having to create a new project? Also, can I easily convert the project from UART back to a semihosting again?
I cannot find a "button" that will do this. It appears that I have to create a new project and select UART instead of Semihosting, and then copy all the code I wrote in the semihosting project to the UART project.
- 新着としてマーク
- ブックマーク
- 購読
- ミュート
- RSS フィードを購読する
- ハイライト
- 印刷
- 不適切なコンテンツを報告
Hi, Jerry,
I do not think it is okay to put the printf() function in the interrupt handler function, because the printf() function is a time-consuming work. pls comment the printf(), for test purpose, toggle a GPIO in the interrupt handler function, does the GPIO toggle repeatedly?
Hope it can help you
BR
XiangJun Rong
- 新着としてマーク
- ブックマーク
- 購読
- ミュート
- RSS フィードを購読する
- ハイライト
- 印刷
- 不適切なコンテンツを報告
It is not my intention to put the printf in the ISR handler. I will put a counter variable in the ISR handler and have it printed in main. But my question here is how do I tell MCUXpresso to avoid using semihosting so I can perform my testing, and then how do I restore the semihosting features after testing?
The following is copied from the MCUXpresso IDE User Guide:
When you have linked with the semihosting library, your application will no longer work standalone – it will only work when connected to the debugger. Semihosting operations cause the CPU to drop into “debug state”, which means that for the duration of the data transfer between the target and the host PC no code (including interrupts) will get executed on the target. Therefore, if your application uses interrupts, then it is normally advisable to avoid the use of semihosting whilst interrupts are active – and certainly within interrupt handlers themselves. If you still need to use printf, then you can retarget the bottom level of the C library to use an alternative communication channel, such as a UART or the Cortex-M CPU’s ITM channel.
- 新着としてマーク
- ブックマーク
- 購読
- ミュート
- RSS フィードを購読する
- ハイライト
- 印刷
- 不適切なコンテンツを報告
Hi,
Pls refer to the following screenshot to know the switch between Uart and semihost. The first step is to select the project.
Hope it can help you
BR
XiangJun Rong
- 新着としてマーク
- ブックマーク
- 購読
- ミュート
- RSS フィードを購読する
- ハイライト
- 印刷
- 不適切なコンテンツを報告
This is what I was looking for, a way to switch between semihosting and UART modes without creating a new project. This should be in the MCUXpresso IDE User Manual. If it is, I didn't see it. If there is any further documentation I have missed, please let me know.
- 新着としてマーク
- ブックマーク
- 購読
- ミュート
- RSS フィードを購読する
- ハイライト
- 印刷
- 不適切なコンテンツを報告
Hi, Jerry,
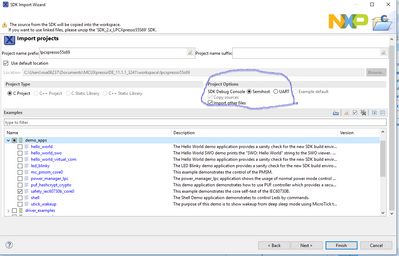
When you import a project or create a new project based on SDK package, pls select the UART instead of semihost as the following figure:
Hope it can help you
BR
XiangJun Rong
- 新着としてマーク
- ブックマーク
- 購読
- ミュート
- RSS フィードを購読する
- ハイライト
- 印刷
- 不適切なコンテンツを報告
I already created my project with semihosting. Is there an easy way to convert to UART without having to create a new project? Also, can I easily convert the project from UART back to a semihosting again?
- 新着としてマーク
- ブックマーク
- 購読
- ミュート
- RSS フィードを購読する
- ハイライト
- 印刷
- 不適切なコンテンツを報告
To find more information on semihosting:
https://community.nxp.com/t5/LPCXpresso-IDE-FAQs/What-is-Semihosting/m-p/475390
And follow the link at the bottom for how to change the library type.

