- Forums
- Product Forums
- General Purpose MicrocontrollersGeneral Purpose Microcontrollers
- i.MX Forumsi.MX Forums
- QorIQ Processing PlatformsQorIQ Processing Platforms
- Identification and SecurityIdentification and Security
- Power ManagementPower Management
- Wireless ConnectivityWireless Connectivity
- RFID / NFCRFID / NFC
- Advanced AnalogAdvanced Analog
- MCX Microcontrollers
- S32G
- S32K
- S32V
- MPC5xxx
- Other NXP Products
- S12 / MagniV Microcontrollers
- Powertrain and Electrification Analog Drivers
- Sensors
- Vybrid Processors
- Digital Signal Controllers
- 8-bit Microcontrollers
- ColdFire/68K Microcontrollers and Processors
- PowerQUICC Processors
- OSBDM and TBDML
- S32M
- S32Z/E
-
- Solution Forums
- Software Forums
- MCUXpresso Software and ToolsMCUXpresso Software and Tools
- CodeWarriorCodeWarrior
- MQX Software SolutionsMQX Software Solutions
- Model-Based Design Toolbox (MBDT)Model-Based Design Toolbox (MBDT)
- FreeMASTER
- eIQ Machine Learning Software
- Embedded Software and Tools Clinic
- S32 SDK
- S32 Design Studio
- GUI Guider
- Zephyr Project
- Voice Technology
- Application Software Packs
- Secure Provisioning SDK (SPSDK)
- Processor Expert Software
- Generative AI & LLMs
-
- Topics
- Mobile Robotics - Drones and RoversMobile Robotics - Drones and Rovers
- NXP Training ContentNXP Training Content
- University ProgramsUniversity Programs
- Rapid IoT
- NXP Designs
- SafeAssure-Community
- OSS Security & Maintenance
- Using Our Community
-
- Cloud Lab Forums
-
- Knowledge Bases
- ARM Microcontrollers
- i.MX Processors
- Identification and Security
- Model-Based Design Toolbox (MBDT)
- QorIQ Processing Platforms
- S32 Automotive Processing Platform
- Wireless Connectivity
- CodeWarrior
- MCUXpresso Suite of Software and Tools
- MQX Software Solutions
- RFID / NFC
- Advanced Analog
-
- NXP Tech Blogs
- Home
- :
- General Purpose Microcontrollers
- :
- Kinetis Microcontrollers
- :
- Re: Debugging issue with KEA128
Debugging issue with KEA128
- Subscribe to RSS Feed
- Mark Topic as New
- Mark Topic as Read
- Float this Topic for Current User
- Bookmark
- Subscribe
- Mute
- Printer Friendly Page
- Mark as New
- Bookmark
- Subscribe
- Mute
- Subscribe to RSS Feed
- Permalink
- Report Inappropriate Content
I have an heavy debug issue with a custom designed KEA128 board:
After starting the debugger I'm not able to step through the program (F5 or F6). I'm using the PE Multilink Universal Debugger and the S32 Design Studio with PE plugin. On other workspaces and the same toolchain the debugging works flawlessly. I'm running into a similar issue if I try to debug this workspace on a TRK-KEA128 evaluation board via OpenSDA. So it seems this issue has something to do with this projects workspace.
Here is what I'm getting in the console windows:
GNU gdb (GNU Tools for ARM Embedded Processors) 7.8.1.20141128-cvs
Copyright (C) 2014 Free Software Foundation, Inc.
License GPLv3+: GNU GPL version 3 or later <http://gnu.org/licenses/gpl.html>
This is free software: you are free to change and redistribute it.
There is NO WARRANTY, to the extent permitted by law. Type "show copying"
and "show warranty" for details.
This GDB was configured as "--host=i686-w64-mingw32 --target=arm-none-eabi".
Type "show configuration" for configuration details.
For bug reporting instructions, please see:
<http://www.gnu.org/software/gdb/bugs/>.
Find the GDB manual and other documentation resources online at:
<http://www.gnu.org/software/gdb/documentation/>.
For help, type "help".
Type "apropos word" to search for commands related to "word".
monitor preserve0 0
monitor selectcore 0
continue
Continuing.
Note: automatically using hardware breakpoints for read-only addresses.
Temporary breakpoint 1, main () at ../source/main.cpp:53
53 PE_low_level_init();
No breakpoint number 1.
and
Connection from "127.0.0.1" via 127.0.0.1
Copyright 2012 P&E Microcomputer Systems,Inc.
Command Line :C:\Freescale\S32_ARM_v1.0\eclipse\plugins\com.pemicro.debug.gdbjtag.pne_2.2.5.201511061812\win32\pegdbserver_console -device=Freescale_KEx_S9KEAZ128M4 -startserver -singlesession -serverport=7224 -interface=USBMULTILINK -speed=5000 -port=US
CMD>RE
Initializing.
Target has been RESET and is active.
CMD>CM C:\Freescale\S32_ARM_v1.0\eclipse\plugins\com.pemicro.debug.gdbjtag.pne_2.2.5.201511061812\win32\gdi\P&E\supportFiles_ARM\Freescale\KEx\freescale_s9keaz128m4_pflash.arp
Initializing.
Initialized.
;version 1.03, 06/02/2014, Copyright 2014 P&E Microcomputer Systems, Inc. All rights reserved. www.pemicro.com [ke_128k_pflash_ftmre_m0]
;device freescale, s9keaz128m4, pflash
;begin_cs device=$00000000, length=$00020000, ram=$20000000
Loading programming algorithm ...
Done.
CMD>EM
Erasing.
Module has been erased.
Initializing.
Initialized.
;version 1.03, 06/02/2014, Copyright 2014 P&E Microcomputer Systems, Inc. All rights reserved. www.pemicro.com [ke_128k_pflash_ftmre_m0]
;device freescale, s9keaz128m4, pflash
;begin_cs device=$00000000, length=$00020000, ram=$20000000
Loading programming algorithm ...
Done.
CMD>PM
Programming.
Processing Object File Data ...
.
Programmed.
CMD>VC
Verifying object file CRC-16 to device ranges ...
block 00000000-000000BF ...
Ok.
block 00000400-0000BBCF ...
Ok.
Checksum Verification Successful. (Cumulative CRC-16=$FF3B)
CMD>RE
Initializing.
Target has been RESET and is active.
Preset breakpoint encountered.
Any ideas?
Thanks in advance!
Solved! Go to Solution.
- Mark as New
- Bookmark
- Subscribe
- Mute
- Subscribe to RSS Feed
- Permalink
- Report Inappropriate Content
Hi 0815,
Please make sure you didn't select "Skip all breakpoints" button:
And then try removing all breakpoints and setting a new one.
Hope it helps!
Best Regards,
Carlos Mendoza
Technical Support Engineer
-----------------------------------------------------------------------------------------------------------------------
Note: If this post answers your question, please click the Correct Answer button. Thank you!
-----------------------------------------------------------------------------------------------------------------------
- Mark as New
- Bookmark
- Subscribe
- Mute
- Subscribe to RSS Feed
- Permalink
- Report Inappropriate Content
- Mark as New
- Bookmark
- Subscribe
- Mute
- Subscribe to RSS Feed
- Permalink
- Report Inappropriate Content
Hi @Lukas_Frank ,
Is this the first time you load a demo application into the board? Please make sure that your board is configured for internal boot and not for serial downloader mode.
Regards,
Carlos Mendoza
- Mark as New
- Bookmark
- Subscribe
- Mute
- Subscribe to RSS Feed
- Permalink
- Report Inappropriate Content
Hi Dear @Carlos_Mendoza ,
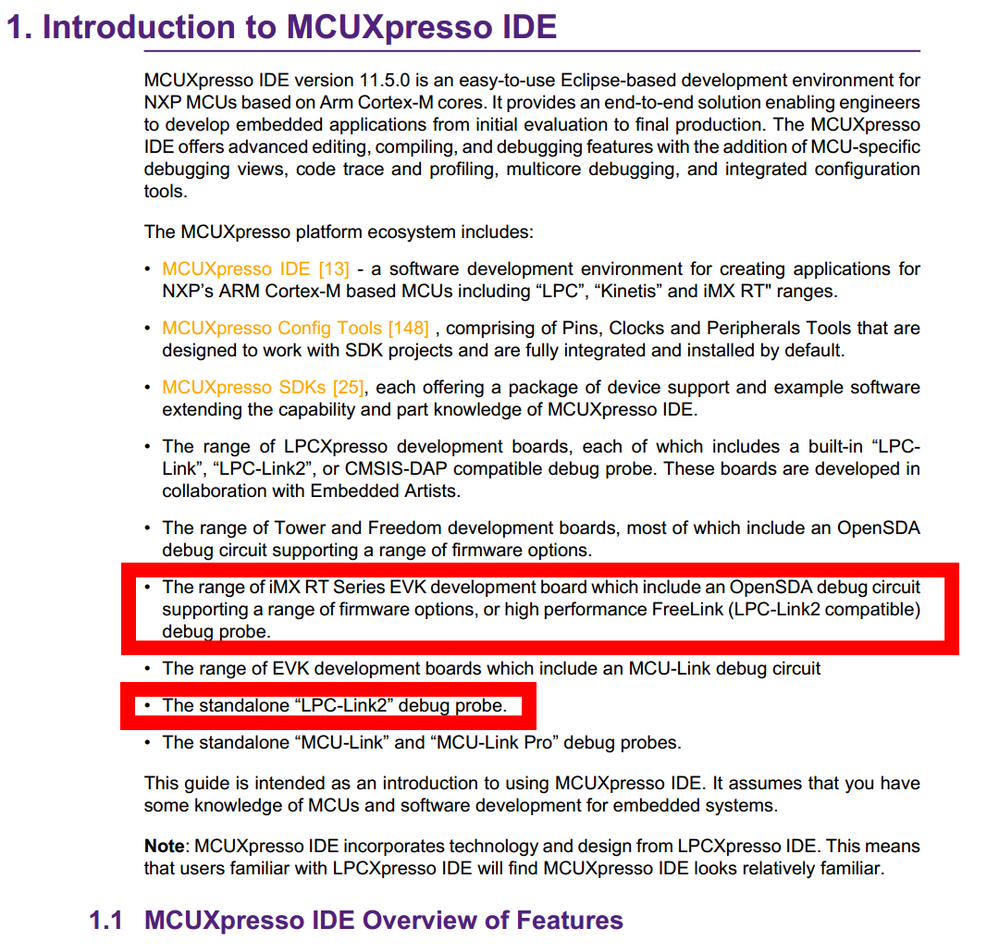
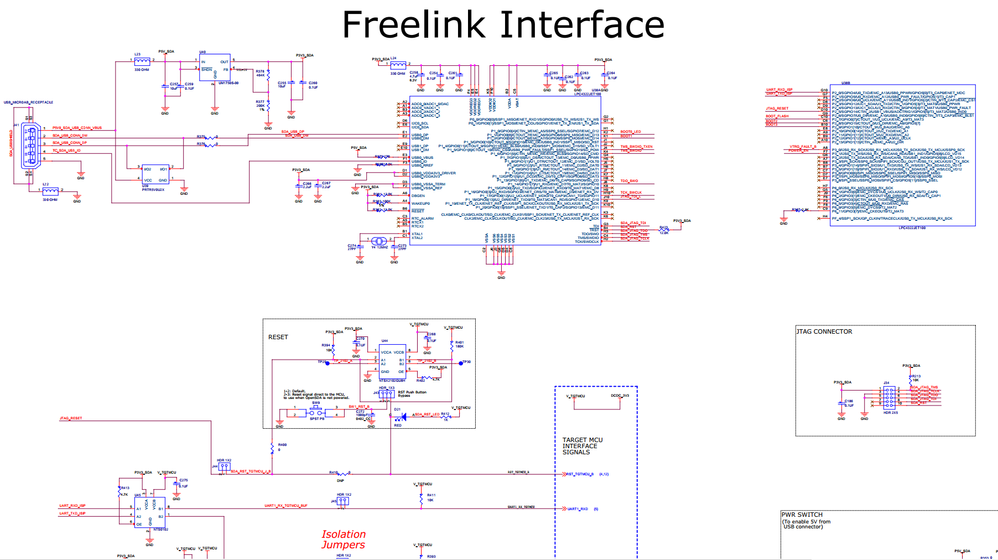
I used internal boot mode as you mentioned. But I think the issue related with my debug configuration. I am using J34 in EVK. But I think I need to use LPC-Link2 Debug Probe for debugging with J34. Could you please clarify me about Am I able to debug with J34 or not? Because reference manual says below and I thought that I will be able to debug my card with J34 if I use FreeLink Interface's JTAG connector. Does this JTAG Connector supports debugging?
First Clue:
Second Clue:
Thanks for your help.
- Mark as New
- Bookmark
- Subscribe
- Mute
- Subscribe to RSS Feed
- Permalink
- Report Inappropriate Content
Hi 0815,
Please make sure you didn't select "Skip all breakpoints" button:
And then try removing all breakpoints and setting a new one.
Hope it helps!
Best Regards,
Carlos Mendoza
Technical Support Engineer
-----------------------------------------------------------------------------------------------------------------------
Note: If this post answers your question, please click the Correct Answer button. Thank you!
-----------------------------------------------------------------------------------------------------------------------
- Mark as New
- Bookmark
- Subscribe
- Mute
- Subscribe to RSS Feed
- Permalink
- Report Inappropriate Content
You are right, it is embarrassing. :smileyblush:


