- Forums
- Product Forums
- General Purpose MicrocontrollersGeneral Purpose Microcontrollers
- i.MX Forumsi.MX Forums
- QorIQ Processing PlatformsQorIQ Processing Platforms
- Identification and SecurityIdentification and Security
- Power ManagementPower Management
- Wireless ConnectivityWireless Connectivity
- RFID / NFCRFID / NFC
- Advanced AnalogAdvanced Analog
- MCX Microcontrollers
- S32G
- S32K
- S32V
- MPC5xxx
- Other NXP Products
- S12 / MagniV Microcontrollers
- Powertrain and Electrification Analog Drivers
- Sensors
- Vybrid Processors
- Digital Signal Controllers
- 8-bit Microcontrollers
- ColdFire/68K Microcontrollers and Processors
- PowerQUICC Processors
- OSBDM and TBDML
- S32M
- S32Z/E
-
- Solution Forums
- Software Forums
- MCUXpresso Software and ToolsMCUXpresso Software and Tools
- CodeWarriorCodeWarrior
- MQX Software SolutionsMQX Software Solutions
- Model-Based Design Toolbox (MBDT)Model-Based Design Toolbox (MBDT)
- FreeMASTER
- eIQ Machine Learning Software
- Embedded Software and Tools Clinic
- S32 SDK
- S32 Design Studio
- GUI Guider
- Zephyr Project
- Voice Technology
- Application Software Packs
- Secure Provisioning SDK (SPSDK)
- Processor Expert Software
- Generative AI & LLMs
-
- Topics
- Mobile Robotics - Drones and RoversMobile Robotics - Drones and Rovers
- NXP Training ContentNXP Training Content
- University ProgramsUniversity Programs
- Rapid IoT
- NXP Designs
- SafeAssure-Community
- OSS Security & Maintenance
- Using Our Community
-
- Cloud Lab Forums
-
- Knowledge Bases
- ARM Microcontrollers
- i.MX Processors
- Identification and Security
- Model-Based Design Toolbox (MBDT)
- QorIQ Processing Platforms
- S32 Automotive Processing Platform
- Wireless Connectivity
- CodeWarrior
- MCUXpresso Suite of Software and Tools
- MQX Software Solutions
- RFID / NFC
- Advanced Analog
-
- NXP Tech Blogs
- Home
- :
- MCUXpresso Software and Tools
- :
- Kinetis Design Studio
- :
- Peripheral viewer doesn't work in Kinetis debugger?
Peripheral viewer doesn't work in Kinetis debugger?
- Subscribe to RSS Feed
- Mark Topic as New
- Mark Topic as Read
- Float this Topic for Current User
- Bookmark
- Subscribe
- Mute
- Printer Friendly Page
- Mark as New
- Bookmark
- Subscribe
- Mute
- Subscribe to RSS Feed
- Permalink
- Report Inappropriate Content
I'm working on a sample application for the K64F (using the Freedom board). The "Peripherals" tab in the debugger is empty. Does this feature not work?
Thanks,
Best Regards, Dave
PS: As a work-around I'm exposing the peripherals using variables pointing at them and then using the expression viewer, which is rather tedious, for example:
DMA_Type* pDMA0 = DMA0; // expose for debugger, since "Peripherals" viewer doesn't work in Kinetis StudioSolved! Go to Solution.
- Mark as New
- Bookmark
- Subscribe
- Mute
- Subscribe to RSS Feed
- Permalink
- Report Inappropriate Content
Hi Dave,
I've never used the "Peripherals" tab...now makes me wonder about it though.
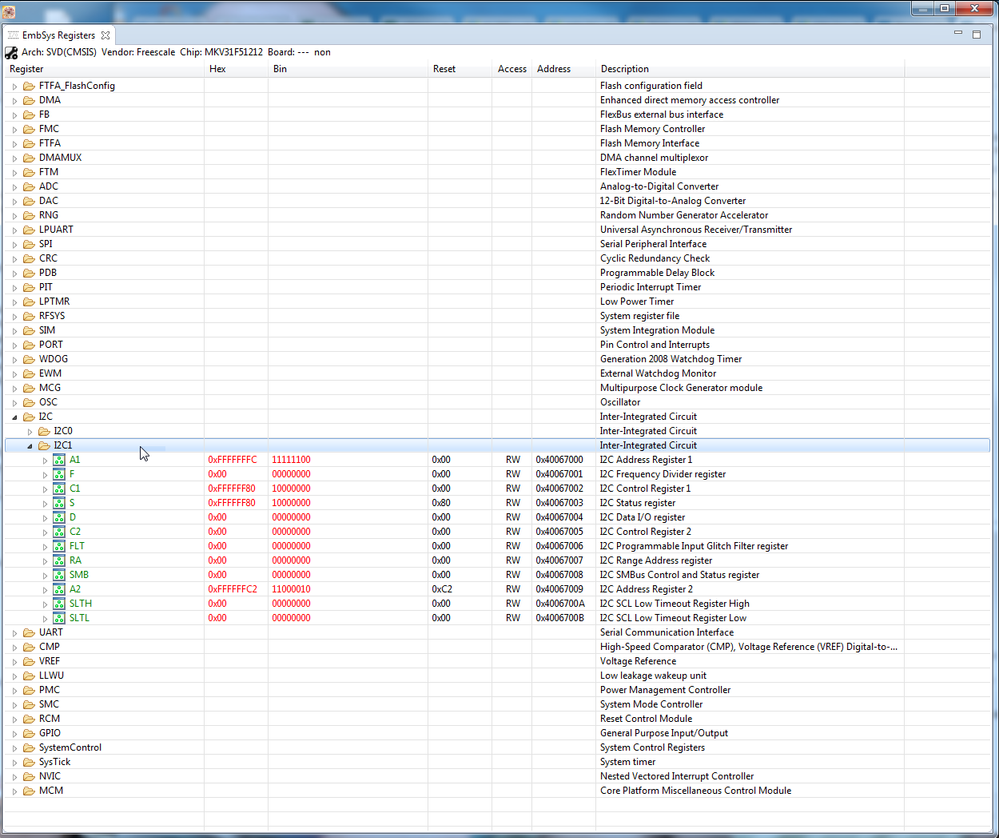
I use the "EmbSys Registers" view to see the peripheral and system registers as the below huge picture shows.
Note I'm using a FRDM-KV31F as example but click on the "Arch" icon in upper left of the picture to switch MCU type.
Also when you open a peripheral "folder" one level. Then double click to the right to open and active it. Same to close it. The Activation means that the debugger will request register updates each time you step or hit breakpoint. So if using a slow debugger interface, having lots of peripheral register folders Activated (my words and terminology) will increase data back and forth and slow interface and debugging.
Regards,
David
- Mark as New
- Bookmark
- Subscribe
- Mute
- Subscribe to RSS Feed
- Permalink
- Report Inappropriate Content
Hi Dave,
the Peripherals tab is part of the GNU ARM Eclipse plugins (The peripherals registers view ) and works with the CMSIS-Packs. Have a read at https://mcuoneclipse.com/2016/02/14/are-arm-cmsis-pack-the-future-of-software-components/
I hope this helps,
Erich
- Mark as New
- Bookmark
- Subscribe
- Mute
- Subscribe to RSS Feed
- Permalink
- Report Inappropriate Content
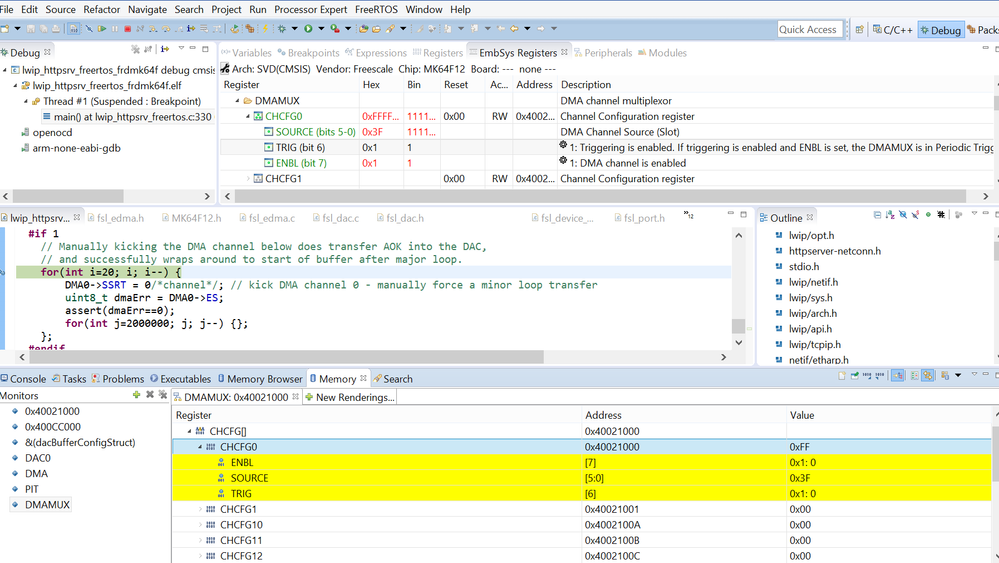
Selecting a peripheral using the The Packs Peripherals creates a "Memory Monitor". Unfortunately, it doesn't update properly during debugging. See below where the DMAMUX enable bit and trigger bit are shown (correctly) as set to 1 in the EmbSys view, but incorrectly as 0 in the monitor created via the Peripherals viewer. Bugs bugs bugs...
- Mark as New
- Bookmark
- Subscribe
- Mute
- Subscribe to RSS Feed
- Permalink
- Report Inappropriate Content
Thanks Eric, I installed the experimental Packs and eventually got the K64F Freedom board support installed and selected for the project. It works but unfortunately suffers from the same problem as the EmbSys viewer above (illogical organization of register sets) - for example there are 14 registers for a DMA channel's TCD, and its impossible to view them as a set. Do you know if there is any way to fix this?
Thanks again,
Best Regards, Dave
- Mark as New
- Bookmark
- Subscribe
- Mute
- Subscribe to RSS Feed
- Permalink
- Report Inappropriate Content
Hi Dave,
both viewers use the information and order of informatino in the CMSIS-SVD files consumed. I'm not aware of any other way to affect the order or what is displayed, other than you can use a text or XML editor and change the content of the SVD files. You find the SVD files inside the CMSIS-Pack directory structure. For the EmbSysRegViewer they are in a subfolder depending on the version number of the viewer, see https://mcuoneclipse.com/2015/09/16/freescale-cmsis-svd-register-files-with-eclipse-mars-and-embsysr...
I hope this helps,
Erich
- Mark as New
- Bookmark
- Subscribe
- Mute
- Subscribe to RSS Feed
- Permalink
- Report Inappropriate Content
Hi Dave,
I've never used the "Peripherals" tab...now makes me wonder about it though.
I use the "EmbSys Registers" view to see the peripheral and system registers as the below huge picture shows.
Note I'm using a FRDM-KV31F as example but click on the "Arch" icon in upper left of the picture to switch MCU type.
Also when you open a peripheral "folder" one level. Then double click to the right to open and active it. Same to close it. The Activation means that the debugger will request register updates each time you step or hit breakpoint. So if using a slow debugger interface, having lots of peripheral register folders Activated (my words and terminology) will increase data back and forth and slow interface and debugging.
Regards,
David
- Mark as New
- Bookmark
- Subscribe
- Mute
- Subscribe to RSS Feed
- Permalink
- Report Inappropriate Content
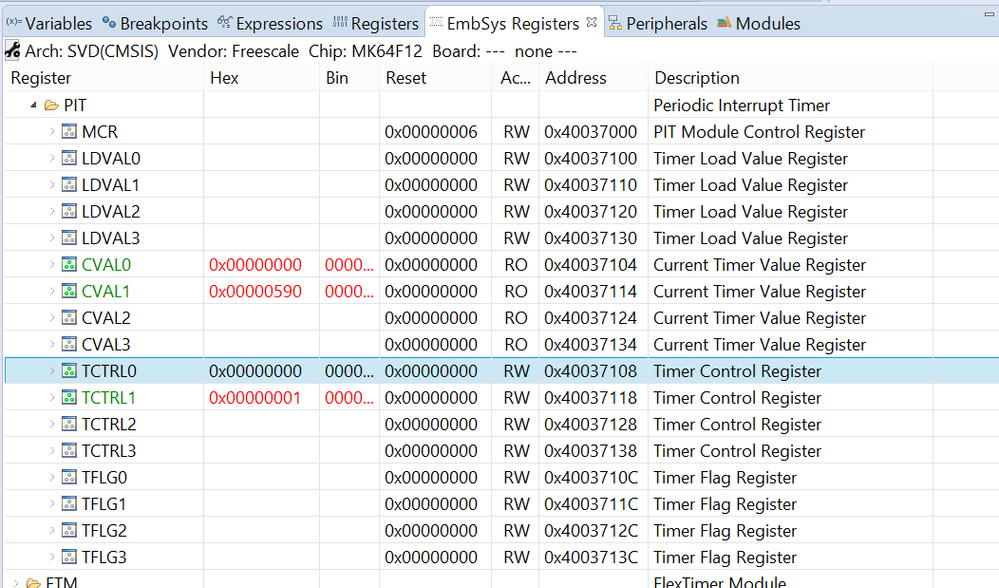
Thanks David, I never would have found the cryptic button to load the processor... So, the EmbSys Registerr viewer works, sort-of: For some reason the registers aren't organized logically! Instead of all the registers for one timer together, it shows all the load value registers for all timers, followed by the counter values... Barely usable for simpler peripherals like PIT, but utterly unusable for things like the DMA controller. Aaarrggg. Really unfortunate. I'll have to continue using the expression kludge, which is too bad because the EmbSys view shows the component bitfields whereas the FreeScale headers don't define these in the overlay structures.
Freescale NXP if you're listening, this is buggy:
- processor should be configured for demos!
- Arrangement of registers is unusable! See (short) example below.
Thanks,
Best Regards, Dave


