- Forums
- Product Forums
- General Purpose MicrocontrollersGeneral Purpose Microcontrollers
- i.MX Forumsi.MX Forums
- QorIQ Processing PlatformsQorIQ Processing Platforms
- Identification and SecurityIdentification and Security
- Power ManagementPower Management
- Wireless ConnectivityWireless Connectivity
- RFID / NFCRFID / NFC
- Advanced AnalogAdvanced Analog
- MCX Microcontrollers
- S32G
- S32K
- S32V
- MPC5xxx
- Other NXP Products
- S12 / MagniV Microcontrollers
- Powertrain and Electrification Analog Drivers
- Sensors
- Vybrid Processors
- Digital Signal Controllers
- 8-bit Microcontrollers
- ColdFire/68K Microcontrollers and Processors
- PowerQUICC Processors
- OSBDM and TBDML
- S32M
- S32Z/E
-
- Solution Forums
- Software Forums
- MCUXpresso Software and ToolsMCUXpresso Software and Tools
- CodeWarriorCodeWarrior
- MQX Software SolutionsMQX Software Solutions
- Model-Based Design Toolbox (MBDT)Model-Based Design Toolbox (MBDT)
- FreeMASTER
- eIQ Machine Learning Software
- Embedded Software and Tools Clinic
- S32 SDK
- S32 Design Studio
- GUI Guider
- Zephyr Project
- Voice Technology
- Application Software Packs
- Secure Provisioning SDK (SPSDK)
- Processor Expert Software
- Generative AI & LLMs
-
- Topics
- Mobile Robotics - Drones and RoversMobile Robotics - Drones and Rovers
- NXP Training ContentNXP Training Content
- University ProgramsUniversity Programs
- Rapid IoT
- NXP Designs
- SafeAssure-Community
- OSS Security & Maintenance
- Using Our Community
-
- Cloud Lab Forums
-
- Knowledge Bases
- ARM Microcontrollers
- i.MX Processors
- Identification and Security
- Model-Based Design Toolbox (MBDT)
- QorIQ Processing Platforms
- S32 Automotive Processing Platform
- Wireless Connectivity
- CodeWarrior
- MCUXpresso Suite of Software and Tools
- MQX Software Solutions
- RFID / NFC
- Advanced Analog
-
- NXP Tech Blogs
- Home
- :
- CodeWarrior
- :
- CodeWarrior Development Tools
- :
- Re: CodeWarrior TAP, IDE and PikeOS
CodeWarrior TAP, IDE and PikeOS
- Subscribe to RSS Feed
- Mark Topic as New
- Mark Topic as Read
- Float this Topic for Current User
- Bookmark
- Subscribe
- Mute
- Printer Friendly Page
CodeWarrior TAP, IDE and PikeOS
- Mark as New
- Bookmark
- Subscribe
- Mute
- Subscribe to RSS Feed
- Permalink
- Report Inappropriate Content
Is there any compability between codewarrior Tap, Codewarrior software IDE and PikeOS?
- Mark as New
- Bookmark
- Subscribe
- Mute
- Subscribe to RSS Feed
- Permalink
- Report Inappropriate Content
Hi,
Please help to provide the chip part number you are using. Thanks.
best regards,
Mike
- Mark as New
- Bookmark
- Subscribe
- Mute
- Subscribe to RSS Feed
- Permalink
- Report Inappropriate Content
Hi Mike,
We have the following device/Software:
- CodeWarrior TAP
- CodeWarrior Development Suites for Networked Applications v11.4.0
- T2080RDB
- PikeOS
In my T2080RDB run a PikeOS native personality. A simple loop which says "Hello world".
In my codewarrior Development, I use my program unstripped which contains "Hello world".
1. I start my T2080RDB, which starts to write in my terminal "hello world"
2. I attach my "hello world" from codewarrior Development
3. I pause from codeWarrior Development. My terminal pause to write "hello world"
4. I click on continue in CodeWarrior Develompent Suite and the terminal print "hello Word again"
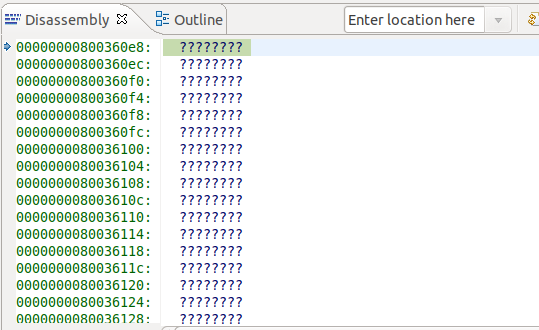
So far, work properly. However, when I take a look to the memory position I see the following:
What am I doing wrong?
- Mark as New
- Bookmark
- Subscribe
- Mute
- Subscribe to RSS Feed
- Permalink
- Report Inappropriate Content
To extend the information in the previous message:
The code of the hello world application is:
int main(void)
{
P4_uid_t me;
P4_timeout_t sleeptime;
/* get my own PikeOS unique Id */
me = p4_my_uid();
/* Startup message. */
vm_cputs("Hello World!!!, starting up.\n");
/* Do the real work */
sleeptime = P4_SEC(2);
for (;;) {
vm_cprintf("Hello World, this is task %d, thread %d\n",
P4_UID_GET_TASK(me), P4_UID_GET_THREAD(me));
p4_sleep(sleeptime);
}
}
We can see that the address of main is:
$ nm -S hello.unstripped | grep main
08017820 00000068 T main
and the binary content of main is:
$ objdump -d hello.unstripped | sed -n '/<main>:/,+5p'
08017820 <main>:
8017820: 94 21 ff e0 stwu r1,-32(r1)
8017824: 7c 08 02 a6 mflr r0
8017828: 90 01 00 24 stw r0,36(r1)
801782c: 93 a1 00 14 stw r29,20(r1)
8017830: 93 c1 00 18 stw r30,24(r1)
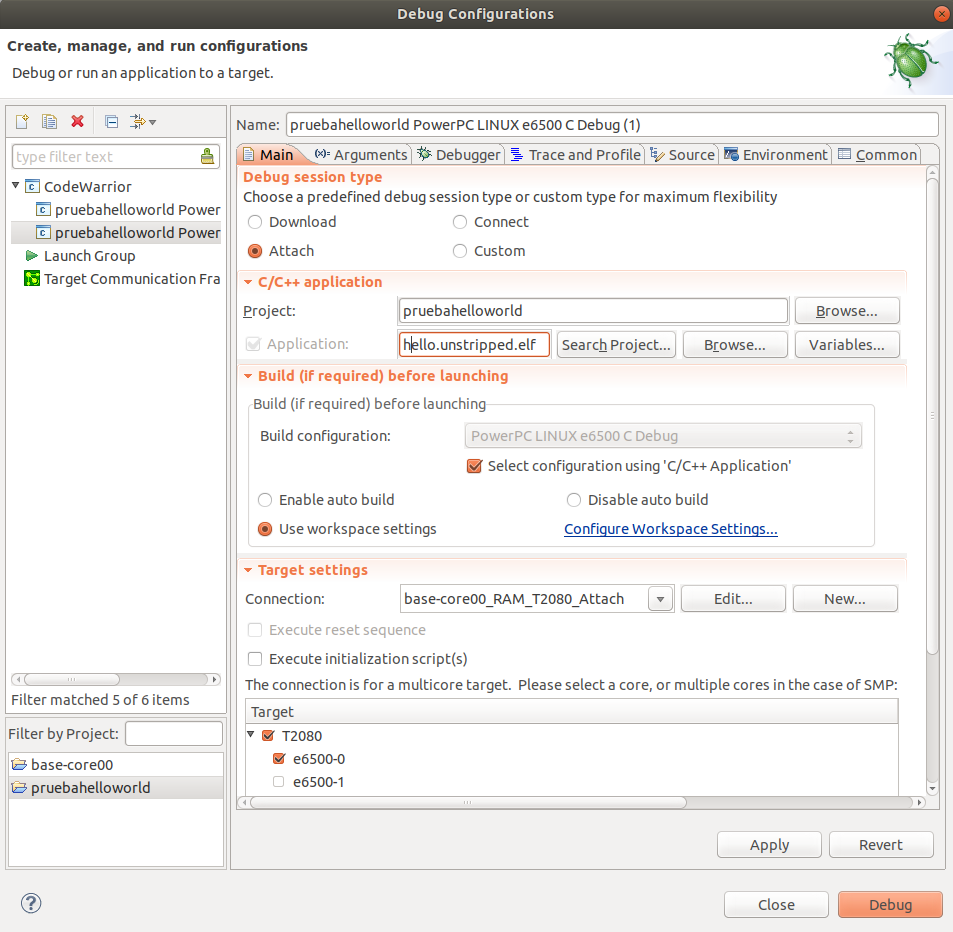
We create a codewarrior bareboard project(QoIQ_T2 family and T2080 processor), using board T2080RDB-PCIe with attach launch and the connection type codeWarrior TAP(over Ethernet)· The next screenshot shows the debug configuration:
We stop the execution of the program with the Multicore Suspend button:
where we can see that cores are stopped in address 0xFFFFFFFC or 0x800360E8, that are addresses out of the text range of the application. At this stage we can see that the execution is actually stopped because we don't get new hello world messages in the console.
We try to setup the memory monitor in the address 0x8017820 (the address of main) and we only can see words with the DEADBEEF value (both in Virtual and physical spaces), so we deduce that the memory monitor cannot see the actual memory.
If we try to setup a memory monitor at 0x800360e8 (the address where some of the cores are stopped) we only can see ???????? words (both in Virtual and physical spaces).
We tried a pure baremetal application (without any OS) and we were able to see the actual memory and even doing step execution, but at the moment that we have an OS we only can suspend and resume.
- Mark as New
- Bookmark
- Subscribe
- Mute
- Subscribe to RSS Feed
- Permalink
- Report Inappropriate Content
Hello manolo ruiz,
For T2080 processor, please download and install CodeWarrior for PA 10.5.1.
The Attach launch configuration is often used to debug program boot from NOR flash, for example debugging u-boot.
If you want to download the program to RAM then perform debugging, you need to use "Download" Launch configuration. You could import the elf to create a project and select "Download" launch configuration.
Thanks,
Yiping
- Mark as New
- Bookmark
- Subscribe
- Mute
- Subscribe to RSS Feed
- Permalink
- Report Inappropriate Content
Hello Yiping,
I would like to thank you for your fast answer. As we comment, our use case is not downloading a bare application to the RAM, as we are using a RTOS whose image is composed by a kernel, several applications and a ROM filesystem.
For this reason, our use case is more similar to the case that you describe about debugging a boot program from NOR flash (for example u-boot as you said). We cannot download the application directly in memory because it would mean that the rest of the system is not downloaded to the board and the execution would be impossible.
We have developed in the previous answer all the configuration of the project in CodeWarrior to make clear what is the configuration that we are using, and we have explained the addresses used in our application only to show the discordance between the actual content of the application and the content showed in the memory monitor of CodeWarrior.
We understand that when we suspend all the cores of the processor and they are using the MMU, when we select a range of addresses in the memory monitor and we select the Virtual Space the content showed in the memory monitor should be correct in the virtual space of the current thread (independently of running in Hypervisor, Supervisor or in user space), but this is not what we are seeing.
I suppose that this use case is very common as a processor so powerful like the T2080 is usually used with RTOS and not only with bare metal applications, but with the information that you provided in your previous answer we still don't know how to proceed with this use case. Do you know if it is possible to use CodeWarrior in such type of environments?, or do I have to derive from your previous answer that CodeWarrior only can be used for bare metal applications?
Kind Regards,
Manolo
- Mark as New
- Bookmark
- Subscribe
- Mute
- Subscribe to RSS Feed
- Permalink
- Report Inappropriate Content
Hello manolo ruiz,
CodeWarrior can be used to debug the ROM version program, you could refer to https://community.nxp.com/docs/DOC-100403 .
Thanks,
Yiping
- Mark as New
- Bookmark
- Subscribe
- Mute
- Subscribe to RSS Feed
- Permalink
- Report Inappropriate Content
Thanks very much for your answer. I have read the document but there is only information to debug u-boot. How can I debug a simple HelloWorld in vxwork or PikeOS? I would like to debug the application. Not U-boot.
Best Regards,
Manolo.
- Mark as New
- Bookmark
- Subscribe
- Mute
- Subscribe to RSS Feed
- Permalink
- Report Inappropriate Content
I don't have the document to debug vxworks or PikeOS.
You could refer to the section "Chapter 7 Debugging Embedded Linux Software" in C:\Freescale\CW_PA_v10.5.1\PA\Help\PDF\Targeting_PA_Processors.pdf.
Thanks,
Yiping
- Mark as New
- Bookmark
- Subscribe
- Mute
- Subscribe to RSS Feed
- Permalink
- Report Inappropriate Content
Hi Manolo,
Thanks for the feedback.
For I don't support DN(T2080) product, I will ask my colleague to help your case.
Thanks for the patience.
best regards,
Mike


