- Forums
- Product Forums
- General Purpose MicrocontrollersGeneral Purpose Microcontrollers
- i.MX Forumsi.MX Forums
- QorIQ Processing PlatformsQorIQ Processing Platforms
- Identification and SecurityIdentification and Security
- Power ManagementPower Management
- Wireless ConnectivityWireless Connectivity
- RFID / NFCRFID / NFC
- Advanced AnalogAdvanced Analog
- MCX Microcontrollers
- S32G
- S32K
- S32V
- MPC5xxx
- Other NXP Products
- S12 / MagniV Microcontrollers
- Powertrain and Electrification Analog Drivers
- Sensors
- Vybrid Processors
- Digital Signal Controllers
- 8-bit Microcontrollers
- ColdFire/68K Microcontrollers and Processors
- PowerQUICC Processors
- OSBDM and TBDML
- S32M
- S32Z/E
-
- Solution Forums
- Software Forums
- MCUXpresso Software and ToolsMCUXpresso Software and Tools
- CodeWarriorCodeWarrior
- MQX Software SolutionsMQX Software Solutions
- Model-Based Design Toolbox (MBDT)Model-Based Design Toolbox (MBDT)
- FreeMASTER
- eIQ Machine Learning Software
- Embedded Software and Tools Clinic
- S32 SDK
- S32 Design Studio
- GUI Guider
- Zephyr Project
- Voice Technology
- Application Software Packs
- Secure Provisioning SDK (SPSDK)
- Processor Expert Software
- Generative AI & LLMs
-
- Topics
- Mobile Robotics - Drones and RoversMobile Robotics - Drones and Rovers
- NXP Training ContentNXP Training Content
- University ProgramsUniversity Programs
- Rapid IoT
- NXP Designs
- SafeAssure-Community
- OSS Security & Maintenance
- Using Our Community
-
- Cloud Lab Forums
-
- Knowledge Bases
- ARM Microcontrollers
- i.MX Processors
- Identification and Security
- Model-Based Design Toolbox (MBDT)
- QorIQ Processing Platforms
- S32 Automotive Processing Platform
- Wireless Connectivity
- CodeWarrior
- MCUXpresso Suite of Software and Tools
- MQX Software Solutions
- RFID / NFC
- Advanced Analog
-
- NXP Tech Blogs
- Home
- :
- General Purpose Microcontrollers
- :
- Kinetis Microcontrollers
- :
- How to use SWO on Kinetis?
How to use SWO on Kinetis?
- Subscribe to RSS Feed
- Mark Topic as New
- Mark Topic as Read
- Float this Topic for Current User
- Bookmark
- Subscribe
- Mute
- Printer Friendly Page
- Mark as New
- Bookmark
- Subscribe
- Mute
- Subscribe to RSS Feed
- Permalink
- Report Inappropriate Content
I would like to use Cortex M's SWO for debugging on a MK10 and MK20, I own a J-Link and I love using the SWO viewer for debugging.
I usually use STM32 microcontrollers, and I already know how to do the same thing on them, basically setup CoreDebug and ITM, but they also have a ST specific DBGMCU pheripheral that needs to be configured.
DBGMCU only exist on ST chips. What is the equivalent on Kinetis? I do not see any in the KQRUG document. Does that mean I can just write to ITM and see the output? Does the pin automatically default to being a SWO pin instead of GPIO?
Thanks
Solved! Go to Solution.
- Mark as New
- Bookmark
- Subscribe
- Mute
- Subscribe to RSS Feed
- Permalink
- Report Inappropriate Content
got my code working, apparently the answer is that there is Kinetis specific setup required, but the standard Cortex setup for ITM, CoreDebug, and DWT are required.
void swo_init()
{
     uint32_t SWOSpeed = 6000000; //6000kbps, default for JLinkSWOViewer
     uint32_t SWOPrescaler = (F_CPU / SWOSpeed) - 1; // SWOSpeed in Hz, note that F_CPU is expected to be 96000000 in this case
     CoreDebug->DEMCR = CoreDebug_DEMCR_TRCENA_Msk;
     *((volatile unsigned *)(ITM_BASE + 0x400F0)) = 0x00000002; // "Selected PIN Protocol Register": Select which protocol to use for trace output (2: SWO)
     *((volatile unsigned *)(ITM_BASE + 0x40010)) = SWOPrescaler; // "Async Clock Prescaler Register". Scale the baud rate of the asynchronous output
     *((volatile unsigned *)(ITM_BASE + 0x00FB0)) = 0xC5ACCE55; // ITM Lock Access Register, C5ACCE55 enables more write access to Control Register 0xE00 :: 0xFFC
     ITM->TCR = ITM_TCR_TraceBusID_Msk | ITM_TCR_SWOENA_Msk | ITM_TCR_SYNCENA_Msk | ITM_TCR_ITMENA_Msk; // ITM Trace Control Register
     ITM->TPR = ITM_TPR_PRIVMASK_Msk; // ITM Trace Privilege Register
     ITM->TER = 0x00000001; // ITM Trace Enable Register. Enabled tracing on stimulus ports. One bit per stimulus port.
     *((volatile unsigned *)(ITM_BASE + 0x01000)) = 0x400003FE; // DWT_CTRL
     *((volatile unsigned *)(ITM_BASE + 0x40304)) = 0x00000100; // Formatter and Flush Control Register
}

// may not be needed
void swo_deinit()
{
     volatile uint32_t i = 0xFFF;
     while (ITM->PORT[0].u32 == 0 && i--); // wait for any pending transmission
     CoreDebug->DEMCR = 0;
     *((volatile unsigned *)(ITM_BASE + 0x00FB0)) = 0xC5ACCE55; // ITM Lock Access Register, C5ACCE55 enables more write access to Control Register 0xE00 :: 0xFFC
     ITM->TCR = 0;
     ITM->TPR = 0;
     ITM->TER = 0;
}

// function mostly copied from ITM_SendChar
void swo_sendchar(char x)
{
     if (
          (CoreDebug->DHCSR & CoreDebug_DHCSR_C_DEBUGEN_Msk) &&    // if debugger is attached (does it really work?)
          (CoreDebug->DEMCR & CoreDebug_DEMCR_TRCENA_Msk)  &&      // Trace enabled
          (ITM->TCR & ITM_TCR_ITMENA_Msk)                  &&      // ITM enabled
          (ITM->TER & (1UL << 0))                                  // ITM Port #0 enabled
     )
     {
          volatile uint32_t i = 0xFFF; // implement a timeout
          while (ITM->PORT[0].u32 == 0 && i--); // wait for next
          if (ITM->PORT[0].u32 != 0 && i != 0) {
               ITM->PORT[0].u8 = (uint8_t) x; // send
          }
     }
}
- Mark as New
- Bookmark
- Subscribe
- Mute
- Subscribe to RSS Feed
- Permalink
- Report Inappropriate Content
Hello. I'm also "coming" from STM32, and there, under eclipse and SWV tool from Segger - all is fine with SWO debug messages. But this is not the case for me with Kinetis and Code Warrior.
I'm configuring the ITM in similar way like you. Seems it works, because I see an output data frame on SWO output. But I don't have any data in SWO Viewer (Segger's tool). I'm asking me, is it possible that CodeWarrior debug plugin takes the control over the J-link probe and blocks the channel to external SWO tool?
Frank, what kind of IDE you are using with success of SWO view?
- Mark as New
- Bookmark
- Subscribe
- Mute
- Subscribe to RSS Feed
- Permalink
- Report Inappropriate Content
Hi Frank,
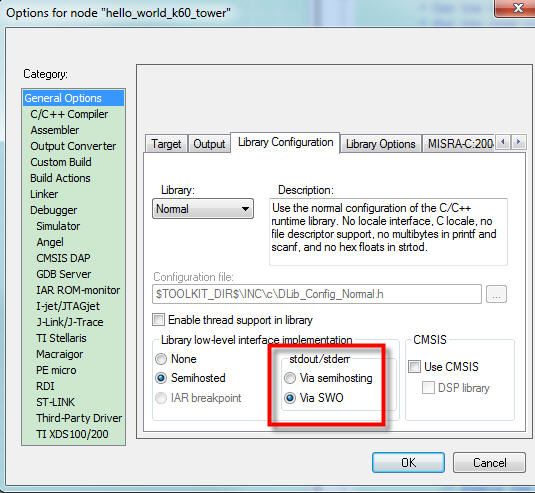
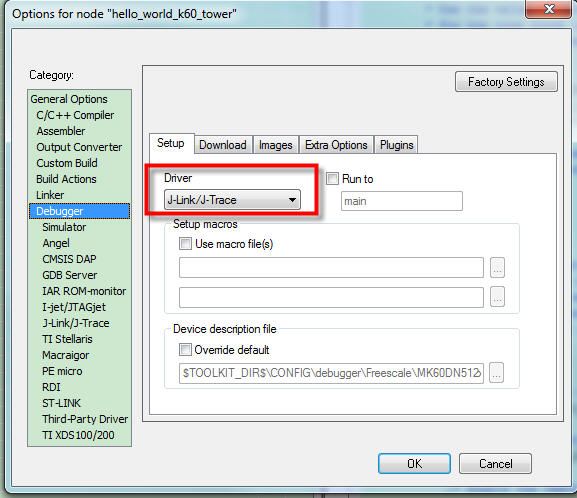
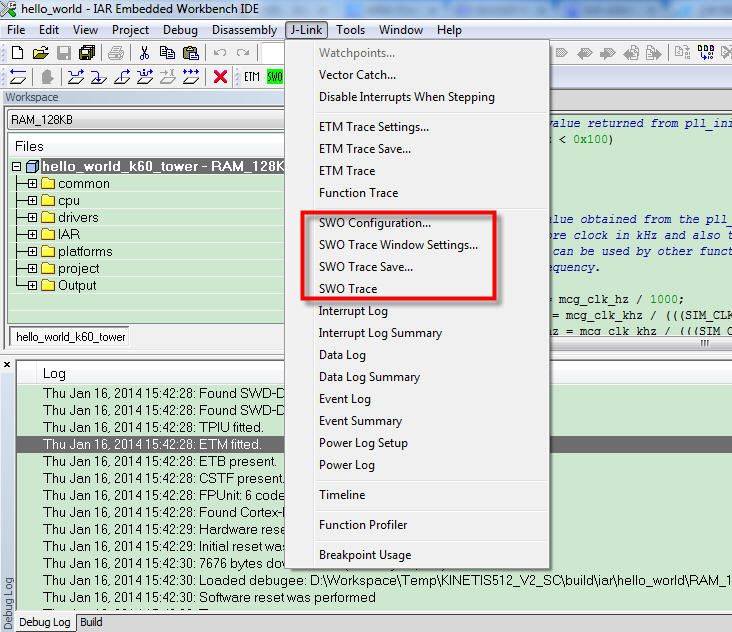
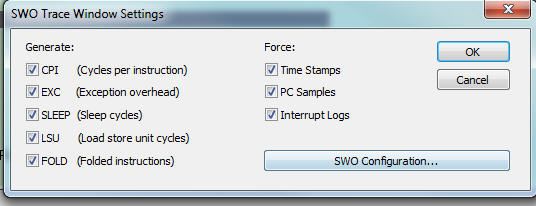
I check IAR ARM Workbench support J-Link SWO debug/Trace.
I do a test with IAR software and record my setting with below pictures.
Wish it could be helpful.
with regards,
Ma Hui
Setting with IAR project option:
Debug panel setting:
- Mark as New
- Bookmark
- Subscribe
- Mute
- Subscribe to RSS Feed
- Permalink
- Report Inappropriate Content
Hi Hui Ma
Thanks but you did not answer my question at all.
DBGMCU only exist on ST chips. What is the equivalent on Kinetis? I do not see any in the KQRUG document. Does that mean I can just write to ITM and see the output? Does the pin automatically default to being a SWO pin instead of GPIO?
I am not using IAR, I am not using any auto-configuration tool of any kind. When you show me how to click those buttons, I need to know what is happening behind the scenes.
- Mark as New
- Bookmark
- Subscribe
- Mute
- Subscribe to RSS Feed
- Permalink
- Report Inappropriate Content
Hi Frank,
I will check this thread. I will let you know when there with any updated info.
Thank you for the patience.
B.R.
Ma Hui


