- Forums
- Product Forums
- General Purpose MicrocontrollersGeneral Purpose Microcontrollers
- i.MX Forumsi.MX Forums
- QorIQ Processing PlatformsQorIQ Processing Platforms
- Identification and SecurityIdentification and Security
- Power ManagementPower Management
- MCX Microcontrollers
- S32G
- S32K
- S32V
- MPC5xxx
- Other NXP Products
- Wireless Connectivity
- S12 / MagniV Microcontrollers
- Powertrain and Electrification Analog Drivers
- Sensors
- Vybrid Processors
- Digital Signal Controllers
- 8-bit Microcontrollers
- ColdFire/68K Microcontrollers and Processors
- PowerQUICC Processors
- OSBDM and TBDML
- S32M
-
- Solution Forums
- Software Forums
- MCUXpresso Software and ToolsMCUXpresso Software and Tools
- CodeWarriorCodeWarrior
- MQX Software SolutionsMQX Software Solutions
- Model-Based Design Toolbox (MBDT)Model-Based Design Toolbox (MBDT)
- FreeMASTER
- eIQ Machine Learning Software
- Embedded Software and Tools Clinic
- S32 SDK
- S32 Design Studio
- GUI Guider
- Zephyr Project
- Voice Technology
- Application Software Packs
- Secure Provisioning SDK (SPSDK)
- Processor Expert Software
- MCUXpresso Training Hub
-
- Topics
- Mobile Robotics - Drones and RoversMobile Robotics - Drones and Rovers
- NXP Training ContentNXP Training Content
- University ProgramsUniversity Programs
- Rapid IoT
- NXP Designs
- SafeAssure-Community
- OSS Security & Maintenance
- Using Our Community
-
- Cloud Lab Forums
-
- Knowledge Bases
- ARM Microcontrollers
- i.MX Processors
- Identification and Security
- Model-Based Design Toolbox (MBDT)
- QorIQ Processing Platforms
- S32 Automotive Processing Platform
- Wireless Connectivity
- CodeWarrior
- MCUXpresso Suite of Software and Tools
- MQX Software Solutions
-
- Home
- :
- i.MX论坛
- :
- i.MX RT 交叉 MCU
- :
- 回复: unable to capture the output using SWO viewer
unable to capture the output using SWO viewer
unable to capture the output using SWO viewer
Hi,
I am currently debugging [MIMXRT1170-EVK] using the Integrated development environment [MCUXpressoIDE] via SEGGER Flasher Portable PLUS as J-LINK. The program that I am using is based on the SDK sample code "evkmimxrt1170_hello_world_demo_cm7".
I am able to run and debug the program without any problems, but I am unable to capture the output using SWO viewer.
Please note that I am able to use SWO by connecting to the Debug USB without using J-LINK. But I want to use SWO with J-LINK.
Please find the other information below:
1. MCUXpressoIDE Version V11.9.0
2. J-Link Version V7.94K
3. Messages sown on J-Link Commander are as follows:
***********************************************************
Type "connect" to establish a target connection, '?' for help
J-Link>connect
Please specify device / core. <Default>: MIMXRT1176XXXA_M7
Type '?' for selection dialog
Device>MIMXRT1176xxxA_M7
Please specify target interface:
J) JTAG (Default)
S) SWD
T) cJTAG
TIF>SWD
Specify target interface speed [kHz]. <Default>: 4000 kHz
Speed>4000 kHz
Device "MIMXRT1176XXXA_M7" selected.
Connecting to target via SWD
Found SW-DP with ID 0x6BA02477
DPIDR: 0x6BA02477
CoreSight SoC-400 or earlier
Scanning AP map to find all available APs
AP[3]: Stopped AP scan as end of AP map has been reached
AP[0]: AHB-AP (IDR: 0x84770001)
AP[1]: AHB-AP (IDR: 0x24770011)
AP[2]: APB-AP (IDR: 0x54770002)
Iterating through AP map to find AHB-AP to use
AP[0]: Core found
AP[0]: AHB-AP ROM base: 0xE00FD000
CPUID register: 0x411FC272. Implementer code: 0x41 (ARM)
Cache: L1 I/D-cache present
Found Cortex-M7 r1p2, Little endian.
Cortex-M: The connected J-Link (S/N 811000013) uses an old firmware module: V1 (current is 2)
FPUnit: 8 code (BP) slots and 0 literal slots
CoreSight components:
ROMTbl[0] @ E00FD000
[0][0]: E00FE000 CID B105100D PID 000BB4C8 ROM Table
ROMTbl[1] @ E00FE000
[1][0]: E00FF000 CID B105100D PID 000BB4C7 ROM Table
ROMTbl[2] @ E00FF000
[2][0]: E000E000 CID B105E00D PID 000BB00C SCS-M7
[2][1]: E0001000 CID B105E00D PID 000BB002 DWT
[2][2]: E0002000 CID B105E00D PID 000BB00E FPB-M7
[2][3]: E0000000 CID B105E00D PID 000BB001 ITM
[1][1]: E0041000 CID B105900D PID 001BB975 ETM-M7
[1][2]: E0042000 CID B105900D PID 004BB906 CTI
[0][1]: E0043000 CID B105900D PID 001BB908 CSTF
I-Cache L1: 32 KB, 512 Sets, 32 Bytes/Line, 2-Way
D-Cache L1: 32 KB, 256 Sets, 32 Bytes/Line, 4-Way
Memory zones:
Zone: "Default" Description: Default access mode
Cortex-M7 identified.
***********************************************************
Please let me know how to capture using SWO viewer while using J-LINK.
I would appreciate any help with this issue. Thank you.
Hi @NaKa85 ,
Thanks for your interest in NXP MIMXRT series.
I am sure you have already tested the AN and references we have provided. I will acquire an RT1170-EVK board and test it locally in the next couple of days, and I will contact you as soon as there is progress.
Also, I suggest you refer to this thread for more information: https://community.nxp.com/t5/i-MX-RT/How-using-SWO-on-RT1170-and-MIMXRT1170-EVK-board/td-p/1494634
Best regards,
Gavin
Hi,
Thank you for your reply. I really appreciate you conducting the tests.
I imported the project [evkmimxrt1170_iled_blinky_cm7_swo] that I received from you to my workspace.
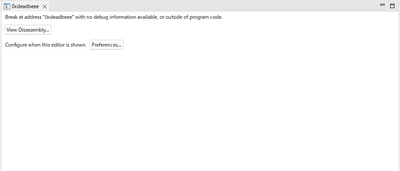
I tried building and executing J-LinkDebug in the IDE, but the program does execute and enter the main() function.
I am using MIMXRT1170-EVK + J-Link + MCUXpressoIDE.
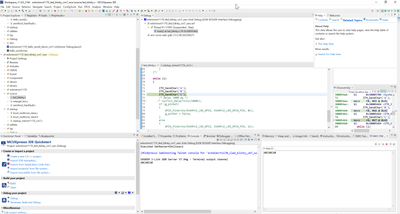
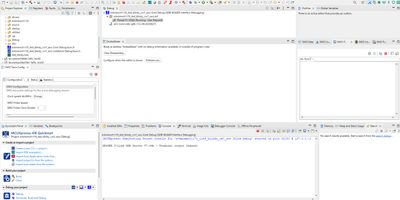
Please find the screenshot after running J-LinkDebug..
Please let me know the next course of action.
Thank you.
Hi @NaKa85 ,
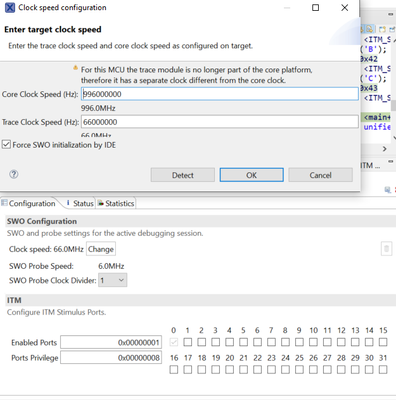
Please configure the Trace Clock Speed to 66 MHz, and, in your attached picture, the "SWD Probe Speed" is not shown, so you should not have stopped long enough.
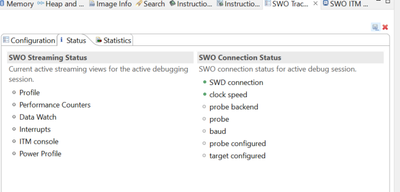
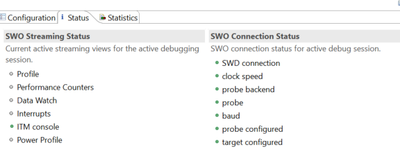
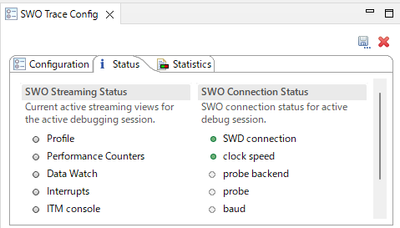
To use the ITM console, start a debug session with the project and run past the inits in main (you need to make sure that the SWO pin and clocks are setup before you attempt to turn on the SWO functions in the IDE, that's why we set a breakpoint here). Then in the SWO Trace Config screen, you have to click on the Change button and set the clock frequency (you need to do this even if you already see the correct frequency shown as this is what activates SWO detection in the IDE. If it is working, the SWO Link speed and Target speed numbers should fill in (might be a bit of delay in the debugger while it is detecting).
Before:
After:
Best regards,
Gavin
Hi,
Thank you for your message.
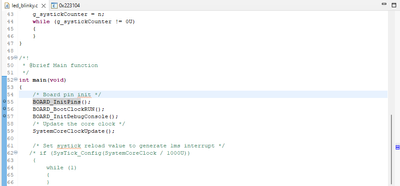
As per your advice, I tried setting a breakpoint in the main function. But, after starting a debug session in the project, it appears like the main function is not called and the control doesn't stop at the breakpoint.
Due to this, I am unable to get past the initialization in the main function and ITM console also doesn't work when I try to set the clock frequency.
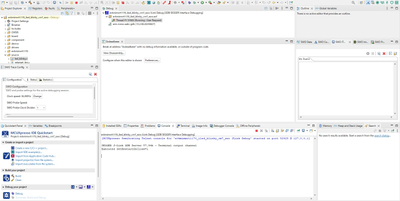
Please find the following screenshots for reference.
Screen immediately after starting the debug session:
SWO trace configuration:
Breakpoint set in main:
The screen that is displayed immediately after the debug session starts (Please note that the main function is not called):
Could it be that the source of the problem is that the main function is not called?
I would appreciate your advice in this matter.
Thank you.
Best regards.
Hi @NaKa85 ,
Sorry for my late reply due to my out of office last week.
We care about your progress and everything you encounter. Now let's get back to this thread.
From my point of view, I have not encountered a similar problem. But speaking from the experience of other customers, it might be a key to check the BootMode pin of your RT1170-EVK.
Make sure SW2 is configured with all zeros and SW1 is configured with 0-0-1-0 and retry the test. If you still have problems, using MCUBootUtility to enter serial download mode(0-0-0-1) and erase all flash should help.
MCUBootUtility tool link is:
https://github.com/JayHeng/NXP-MCUBootUtility/
Hope it helps!
Best regards,
Gavin
Hi,
Thank you for your message.
I have set the SW, but the main function is not called.
Also, I opened the URL you sent, but it says the page cannot be found.
Just in case, please let me know if there is anything I absolutely need to do with the jumper on the MIMXRT1170 board.
I would appreciate your advice.
Image of opening the URL of the MCUBootUtility tool:
Thank you.
Best regards.
Hi @NaKa85 ,
Sorry for my fault, update the link here: https://github.com/JayHeng/NXP-MCUBootUtility/releases
And on my side, use the J38 jumper at 1-2 to power with J43(DC_5V_IN) to prevent interference from the J11's on-board debugger.
Best regards,
Gavin
Hi,
Thank you!
I was able to capture the output using SWO viewer with J-LINK after making the following changes on the RT1170 board:
Short jumpers J5 and J8
Open jumpers J6 and J7
All these four jumpers were initially open.
After adjusting the jumpers and starting a debugging session using the project, the main function is called and I am able to execute the code as expected.
Thank you again for your advice and help.
