
- Forums
- Product Forums
- General Purpose MicrocontrollersGeneral Purpose Microcontrollers
- i.MX Forumsi.MX Forums
- QorIQ Processing PlatformsQorIQ Processing Platforms
- Identification and SecurityIdentification and Security
- Power ManagementPower Management
- Wireless ConnectivityWireless Connectivity
- RFID / NFCRFID / NFC
- Advanced AnalogAdvanced Analog
- Neural Processing UnitsNeural Processing Units
- MCX Microcontrollers
- S32G
- S32K
- S32V
- MPC5xxx
- Other NXP Products
- S12 / MagniV Microcontrollers
- Powertrain and Electrification Analog Drivers
- Sensors
- Vybrid Processors
- Digital Signal Controllers
- 8-bit Microcontrollers
- ColdFire/68K Microcontrollers and Processors
- PowerQUICC Processors
- OSBDM and TBDML
- S32M
- S32Z/E
-
- Solution Forums
- Software Forums
- MCUXpresso Software and ToolsMCUXpresso Software and Tools
- CodeWarriorCodeWarrior
- MQX Software SolutionsMQX Software Solutions
- Model-Based Design Toolbox (MBDT)Model-Based Design Toolbox (MBDT)
- FreeMASTER
- eIQ Machine Learning Software
- Embedded Software and Tools Clinic
- S32 SDK
- S32 Design Studio
- GUI Guider
- Zephyr Project
- Voice Technology
- Application Software Packs
- Secure Provisioning SDK (SPSDK)
- Processor Expert Software
- Generative AI & LLMs
-
- Topics
- Mobile Robotics - Drones and RoversMobile Robotics - Drones and Rovers
- NXP Training ContentNXP Training Content
- University ProgramsUniversity Programs
- Rapid IoT
- NXP Designs
- SafeAssure-Community
- OSS Security & Maintenance
- Using Our Community
-
- Cloud Lab Forums
-
- Knowledge Bases
- ARM Microcontrollers
- i.MX Processors
- Identification and Security
- Model-Based Design Toolbox (MBDT)
- QorIQ Processing Platforms
- S32 Automotive Processing Platform
- Wireless Connectivity
- CodeWarrior
- MCUXpresso Suite of Software and Tools
- MQX Software Solutions
- RFID / NFC
- Advanced Analog
- Neural Processing Units
-
- NXP Tech Blogs
- Home
- :
- i.MX フォーラム
- :
- i.MXプロセッサ
- :
- i.mx28 system timer/clock problem
i.mx28 system timer/clock problem
- RSS フィードを購読する
- トピックを新着としてマーク
- トピックを既読としてマーク
- このトピックを現在のユーザーにフロートします
- ブックマーク
- 購読
- ミュート
- 印刷用ページ
- 新着としてマーク
- ブックマーク
- 購読
- ミュート
- RSS フィードを購読する
- ハイライト
- 印刷
- 不適切なコンテンツを報告
Hello,
While testing the real-time ability of my imx287 I came across some problems.
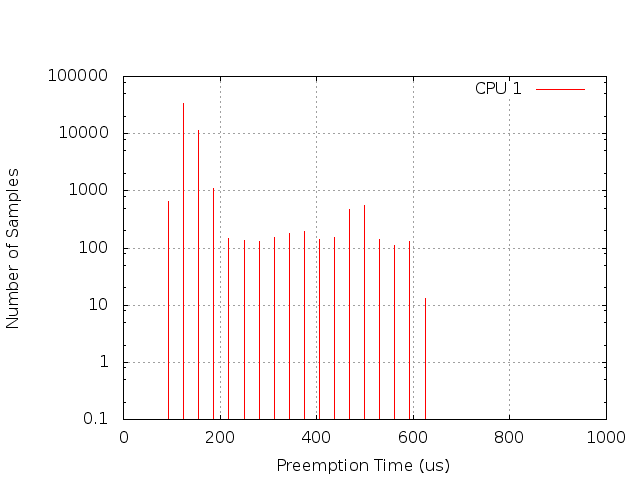
First I created a latency histogram with cyclictest. The histogram I got looked like a comb.
Between 100 and 640us there were vertical lines with a distance of 32us to each other.
Then I tried to use ftrace, to get some more latency values.
I got this result:
function_graph: duration 0.000 or 10000.00us
irqsoff: time 0us or 200000us
sched_event: timestamp xxx0000
The last interesting thing I found out was the result of a simple c-program.
I took two timestamps and calculated the difference:
struct timeval start, stop, diff; gettimeofday(&start,NULL); gettimeofday(&stop, NULL); timersub(&stop, &start, &diff); clock_gettime(CLOCK_MONOTONIC, &start); clock_gettime(CLOCK_MONOTONIC, &stop); diff = time_diff(start, stop);
I run this program on different machines with this result:
TX28(i.mx287): mostly 0ns, sometimes 32250ns
RaspberryPi: 1000-5000ns
I7-870: 200-500ns
It looks like a 32us resolution to me.
The TX28-Starterkit is simular to the imx28evk.
I use the mainline kernel 3.3 with the tx28 patch.
It seems the patch doesn't change clock/timer code.
Is this phenomenon right for the i.mx28 or is there a bug in the kernel (port)?
Has anybody else recognised this problem using i.mx28?
Maybe someone could try this on the imx28evk.
Where could be the problem?
Original Attachment has been moved to: trace_timer_output.txt.zip
解決済! 解決策の投稿を見る。
- 新着としてマーク
- ブックマーク
- 購読
- ミュート
- RSS フィードを購読する
- ハイライト
- 印刷
- 不適切なコンテンツを報告
That is normal because gettimeofday in imx28 has 31.25usec resolution.
The timer is sourced from 32000Hz clock, see mx28_timer_init() in kernel code.
Regards,
Jacky
- 新着としてマーク
- ブックマーク
- 購読
- ミュート
- RSS フィードを購読する
- ハイライト
- 印刷
- 不適切なコンテンツを報告
That is normal because gettimeofday in imx28 has 31.25usec resolution.
The timer is sourced from 32000Hz clock, see mx28_timer_init() in kernel code.
Regards,
Jacky
- 新着としてマーク
- ブックマーク
- 購読
- ミュート
- RSS フィードを購読する
- ハイライト
- 印刷
- 不適切なコンテンツを報告
Hi,
thanks for your answers,
that's exactly what I am locking for.
I changed the clock source and got a better resolution!
And yes, good point, I should protect my code.
- 新着としてマーク
- ブックマーク
- 購読
- ミュート
- RSS フィードを購読する
- ハイライト
- 印刷
- 不適切なコンテンツを報告
Hi Bernhard R.
We are facing same issue!
Could you plz provide details on how you have changed clock source?
sched_clock: 32 bits at 24MHz, resolution 41ns, wraps every 178956969942ns
Thank you in advance,
Pradip.
- 新着としてマーク
- ブックマーク
- 購読
- ミュート
- RSS フィードを購読する
- ハイライト
- 印刷
- 不適切なコンテンツを報告
Hi, Bernhard
Is it possible that the big difference you got on i.MX287 is caused by kernel scheduler? I meant when finishing the collection of start time, then this process is scheduled out, then when it scheduled back, the end time will be much larger. If so, can you try to add some protection to make sure there is no task switch between them, you can try to disable interrupt before executing this code piece.