- Forums
- Product Forums
- General Purpose MicrocontrollersGeneral Purpose Microcontrollers
- i.MX Forumsi.MX Forums
- QorIQ Processing PlatformsQorIQ Processing Platforms
- Identification and SecurityIdentification and Security
- Power ManagementPower Management
- MCX Microcontrollers
- S32G
- S32K
- S32V
- MPC5xxx
- Other NXP Products
- Wireless Connectivity
- S12 / MagniV Microcontrollers
- Powertrain and Electrification Analog Drivers
- Sensors
- Vybrid Processors
- Digital Signal Controllers
- 8-bit Microcontrollers
- ColdFire/68K Microcontrollers and Processors
- PowerQUICC Processors
- OSBDM and TBDML
- S32M
-
- Solution Forums
- Software Forums
- MCUXpresso Software and ToolsMCUXpresso Software and Tools
- CodeWarriorCodeWarrior
- MQX Software SolutionsMQX Software Solutions
- Model-Based Design Toolbox (MBDT)Model-Based Design Toolbox (MBDT)
- FreeMASTER
- eIQ Machine Learning Software
- Embedded Software and Tools Clinic
- S32 SDK
- S32 Design Studio
- GUI Guider
- Zephyr Project
- Voice Technology
- Application Software Packs
- Secure Provisioning SDK (SPSDK)
- Processor Expert Software
- MCUXpresso Training Hub
-
- Topics
- Mobile Robotics - Drones and RoversMobile Robotics - Drones and Rovers
- NXP Training ContentNXP Training Content
- University ProgramsUniversity Programs
- Rapid IoT
- NXP Designs
- SafeAssure-Community
- OSS Security & Maintenance
- Using Our Community
-
- Cloud Lab Forums
-
- Knowledge Bases
- ARM Microcontrollers
- i.MX Processors
- Identification and Security
- Model-Based Design Toolbox (MBDT)
- QorIQ Processing Platforms
- S32 Automotive Processing Platform
- Wireless Connectivity
- CodeWarrior
- MCUXpresso Suite of Software and Tools
- MQX Software Solutions
-
- Home
- :
- i.MX Forums
- :
- i.MX Processors
- :
- Re: Question, i.MX8M ARM_PLATFORM_xxx pins
Question, i.MX8M ARM_PLATFORM_xxx pins
- Subscribe to RSS Feed
- Mark Topic as New
- Mark Topic as Read
- Float this Topic for Current User
- Bookmark
- Subscribe
- Mute
- Printer Friendly Page
- Mark as New
- Bookmark
- Subscribe
- Mute
- Subscribe to RSS Feed
- Permalink
- Report Inappropriate Content
Dear team,
After reading 8.1.1.1 ‘Muxing Options’ in i.MX8M reference manual, my customer could not find the description of ARM_PLATFORM_XXX usage.
Could you show me how to use those pins?
Thanks,
Miyamoto
Solved! Go to Solution.
- Mark as New
- Bookmark
- Subscribe
- Mute
- Subscribe to RSS Feed
- Permalink
- Report Inappropriate Content
Hello
I apologize for the delay
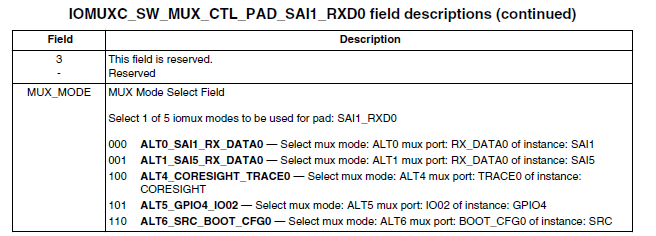
Those pins are for ETM trace. If you want to use these as trace outputs, you set the IOMUX mode to ALT4 and the corresponding pin will be a trace output.
For example TRACE0: Set MUX_MODE to 4 to make the pin an ETM trace output.
IOMUXC_SW_MUX_CTL_PAD_SAI1_RXD0 field descriptions
You would use this in combination with a debugger that supports ETM trace capture. With this capability, it is possible to see the program execution that leads to the event.
For information on the debug & trace functionality, please see chapter 4 of the RM.
For details on CoreSight, JTAG debug & ETM, please refer to the ARM documentation which is available on the ARM web site.
In general, such information is only needed for developing a debugger. For normal use, it is sufficient to set the I/O mux and optionally any debugger specific settings.
Best Regards,
Diego.
- Mark as New
- Bookmark
- Subscribe
- Mute
- Subscribe to RSS Feed
- Permalink
- Report Inappropriate Content
Dear team,
I am still waiting for your RE.
Thanks,
Miyamoto
