- Forums
- Product Forums
- General Purpose MicrocontrollersGeneral Purpose Microcontrollers
- i.MX Forumsi.MX Forums
- QorIQ Processing PlatformsQorIQ Processing Platforms
- Identification and SecurityIdentification and Security
- Power ManagementPower Management
- MCX Microcontrollers
- S32G
- S32K
- S32V
- MPC5xxx
- Other NXP Products
- Wireless Connectivity
- S12 / MagniV Microcontrollers
- Powertrain and Electrification Analog Drivers
- Sensors
- Vybrid Processors
- Digital Signal Controllers
- 8-bit Microcontrollers
- ColdFire/68K Microcontrollers and Processors
- PowerQUICC Processors
- OSBDM and TBDML
- S32M
-
- Solution Forums
- Software Forums
- MCUXpresso Software and ToolsMCUXpresso Software and Tools
- CodeWarriorCodeWarrior
- MQX Software SolutionsMQX Software Solutions
- Model-Based Design Toolbox (MBDT)Model-Based Design Toolbox (MBDT)
- FreeMASTER
- eIQ Machine Learning Software
- Embedded Software and Tools Clinic
- S32 SDK
- S32 Design Studio
- GUI Guider
- Zephyr Project
- Voice Technology
- Application Software Packs
- Secure Provisioning SDK (SPSDK)
- Processor Expert Software
- MCUXpresso Training Hub
-
- Topics
- Mobile Robotics - Drones and RoversMobile Robotics - Drones and Rovers
- NXP Training ContentNXP Training Content
- University ProgramsUniversity Programs
- Rapid IoT
- NXP Designs
- SafeAssure-Community
- OSS Security & Maintenance
- Using Our Community
-
- Cloud Lab Forums
-
- Knowledge Bases
- ARM Microcontrollers
- i.MX Processors
- Identification and Security
- Model-Based Design Toolbox (MBDT)
- QorIQ Processing Platforms
- S32 Automotive Processing Platform
- Wireless Connectivity
- CodeWarrior
- MCUXpresso Suite of Software and Tools
- MQX Software Solutions
-
- RSS フィードを購読する
- トピックを新着としてマーク
- トピックを既読としてマーク
- このトピックを現在のユーザーにフロートします
- ブックマーク
- 購読
- ミュート
- 印刷用ページ
Ask a question about UsageFault abnormal interruption
- 新着としてマーク
- ブックマーク
- 購読
- ミュート
- RSS フィードを購読する
- ハイライト
- 印刷
- 不適切なコンテンツを報告
Hello everyone, I would like to ask a question about the abnormal interruption of UsageFault. There are two S32K144 boards in the mass-produced products of the customer that are constantly reset (there is a watchdog) (the boards of other products are normal, and it is normal to burn the same set of software to other boards. ) There is a UsageFault abnormal interrupt, we use Lauterbach to locate the error in the INVSTATE status bit and cause the UsageFault abnormal interrupt. What is the reason for the error of the INVSTATE status bit?
The following is the analysis test situation:
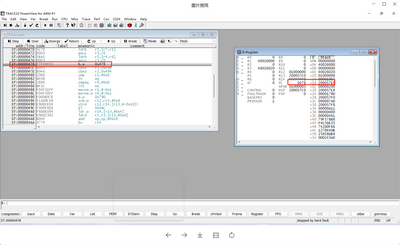
We got the HEX file that the customer gave to close the watchdog, and burned it to the abnormal chip for testing. Use Lauterbach to read the core register of S32K144, after running at full speed, it is stuck at address 0x478.
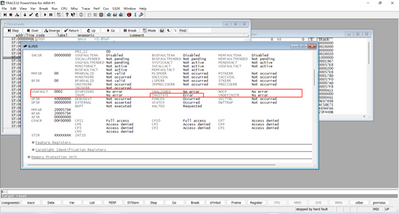
Check the kernel register and find the UsageFault interrupt exception, and check the kernel register and find that the Error in the INVSTATE status bit causes the UsageFault interrupt exception.
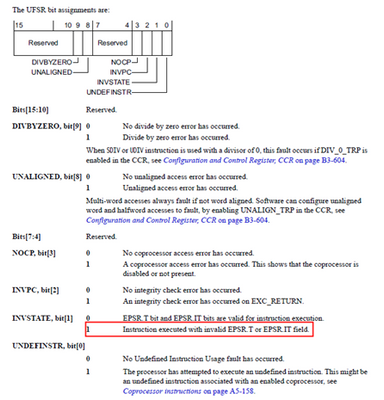
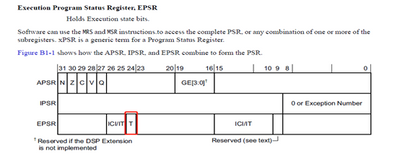
The following figure is the description of the status bit
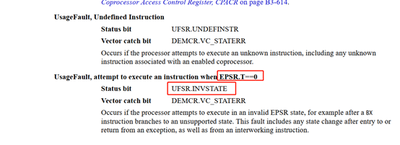
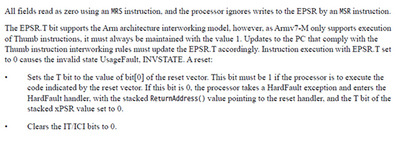
According to the description in the following figure, it can be seen that when EPSR.T==0, attempting to execute the instruction results in a UsageFault
- 新着としてマーク
- ブックマーク
- 購読
- ミュート
- RSS フィードを購読する
- ハイライト
- 印刷
- 不適切なコンテンツを報告
Hello @caiguanyun,
The instruction b.w 0x478 at 0x478 can be something like while(1){}.
I don't think this is the root cause here.
Can you halt the execution in the Hard Fault handler (or Usage Fault handler if enabled) and read the Stack?
You should find the fault instruction on the stack.
Please follow this document / sample code:
https://community.nxp.com/t5/S32K-Knowledge-Base/Fault-handling-on-S32K14x/ta-p/1114447
Regards,
Daniel
- 新着としてマーク
- ブックマーク
- 購読
- ミュート
- RSS フィードを購読する
- ハイライト
- 印刷
- 不適切なコンテンツを報告
The customer has only two boards in the INVSTATE state, which leads to the abnormal interruption of the UsageFault. The other same boards are running normally. Is it a software problem or a hardware problem?
- 新着としてマーク
- ブックマーク
- 購読
- ミュート
- RSS フィードを購読する
- ハイライト
- 印刷
- 不適切なコンテンツを報告
Hello @caiguanyun,
Hard to say at this moment.
Please find the the PC address of the fault exception on the stack.
The code that you showed is probably while(1){} loop in the UsageFault_Handler() and the MCU is waiting for WDOG reset, correct?
If so, you should be able to open the memory window, locate the Stack and the PC address of the fault instruction on the Stack.
Then, in Disassembly window, you can find the instruction.
BR, Daniel
- 新着としてマーク
- ブックマーク
- 購読
- ミュート
- RSS フィードを購読する
- ハイライト
- 印刷
- 不適切なコンテンツを報告
No, because I don't have the client code, I can't debug it, so I can only ask the client to turn off the watchdog of the program. When the program runs away abnormally, I can use Lauterbach to check the kernel register value.
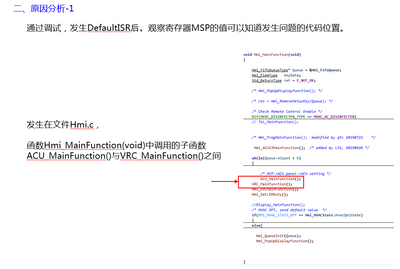
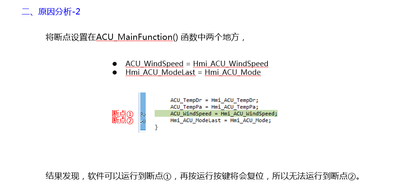
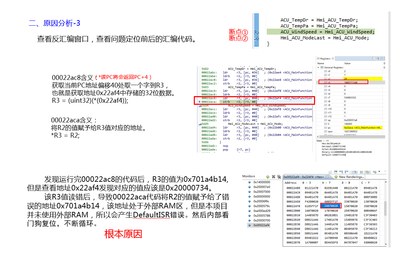
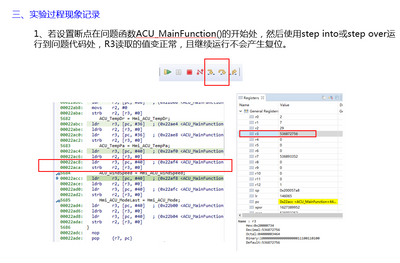
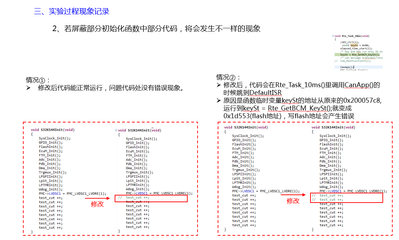
The following picture shows the whole process of customer debug debugging and analysis. By viewing the disassembly window, it is found that it is caused by the use of addresses outside the SRAM area.
Also please help to analyze the reason, thank you very much,If you have any questions, please email me, Email: caiguanyun@zlgmcu.com
