- Forums
- Product Forums
- General Purpose MicrocontrollersGeneral Purpose Microcontrollers
- i.MX Forumsi.MX Forums
- QorIQ Processing PlatformsQorIQ Processing Platforms
- Identification and SecurityIdentification and Security
- Power ManagementPower Management
- Wireless ConnectivityWireless Connectivity
- RFID / NFCRFID / NFC
- MCX Microcontrollers
- S32G
- S32K
- S32V
- MPC5xxx
- Other NXP Products
- S12 / MagniV Microcontrollers
- Powertrain and Electrification Analog Drivers
- Sensors
- Vybrid Processors
- Digital Signal Controllers
- 8-bit Microcontrollers
- ColdFire/68K Microcontrollers and Processors
- PowerQUICC Processors
- OSBDM and TBDML
- S32M
-
- Solution Forums
- Software Forums
- MCUXpresso Software and ToolsMCUXpresso Software and Tools
- CodeWarriorCodeWarrior
- MQX Software SolutionsMQX Software Solutions
- Model-Based Design Toolbox (MBDT)Model-Based Design Toolbox (MBDT)
- FreeMASTER
- eIQ Machine Learning Software
- Embedded Software and Tools Clinic
- S32 SDK
- S32 Design Studio
- GUI Guider
- Zephyr Project
- Voice Technology
- Application Software Packs
- Secure Provisioning SDK (SPSDK)
- Processor Expert Software
-
- Topics
- Mobile Robotics - Drones and RoversMobile Robotics - Drones and Rovers
- NXP Training ContentNXP Training Content
- University ProgramsUniversity Programs
- Rapid IoT
- NXP Designs
- SafeAssure-Community
- OSS Security & Maintenance
- Using Our Community
-
- Cloud Lab Forums
-
- Knowledge Bases
- ARM Microcontrollers
- i.MX Processors
- Identification and Security
- Model-Based Design Toolbox (MBDT)
- QorIQ Processing Platforms
- S32 Automotive Processing Platform
- Wireless Connectivity
- CodeWarrior
- MCUXpresso Suite of Software and Tools
- MQX Software Solutions
-
- Home
- :
- ソフトウェア・フォーラム
- :
- S32 デザインスタジオ
- :
- Can i use debug shell by command line in S32DS? For example, I can use tcl language in debug shell in CW10.
Can i use debug shell by command line in S32DS? For example, I can use tcl language in debug shell in CW10.
- RSS フィードを購読する
- トピックを新着としてマーク
- トピックを既読としてマーク
- このトピックを現在のユーザーにフロートします
- ブックマーク
- 購読
- ミュート
- 印刷用ページ
Can i use debug shell by command line in S32DS? For example, I can use tcl language in debug shell in CW10.
- 新着としてマーク
- ブックマーク
- 購読
- ミュート
- RSS フィードを購読する
- ハイライト
- 印刷
- 不適切なコンテンツを報告
- 新着としてマーク
- ブックマーク
- 購読
- ミュート
- RSS フィードを購読する
- ハイライト
- 印刷
- 不適切なコンテンツを報告
Hello Martin,
Thank you for your quick reply. It's very helpfull.
For my specific application, could I set break point with debug script via Jlink or P&E debugger when open S32DS?
I am ultilizing S32 Design Studio for ARM, Version: 1.2, Build id: 160412.
Many thanks,
Tuan
- 新着としてマーク
- ブックマーク
- 購読
- ミュート
- RSS フィードを購読する
- ハイライト
- 印刷
- 不適切なコンテンツを報告
Hello Tuan,
what do you think by set break point with debug script? Would you like to add breakpoint to your application via GDB client? If yes, this could be certainly possible, but please give me some time to study the gdb.
Regards,
Martin
- 新着としてマーク
- ブックマーク
- 購読
- ミュート
- RSS フィードを購読する
- ハイライト
- 印刷
- 不適切なコンテンツを報告
Hello,
I am not sure if I understand your question correct, but there are some options how to use debug shell by command line in S32 Design Studio.
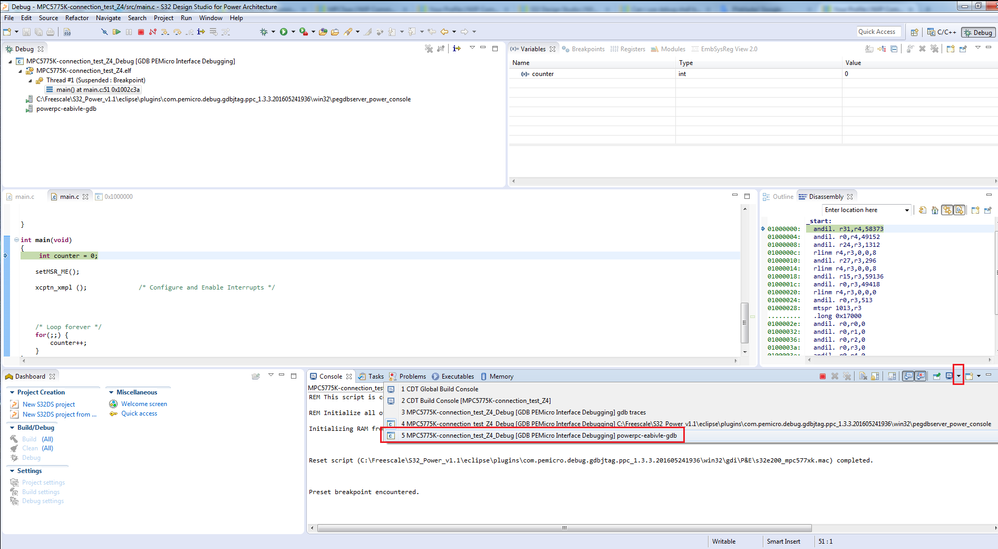
1) The simplest way is to start S32 Design Studio IDE and connect to some board. After the program is loaded, you should see the following screen. Click on the arrow in the red box and choose powerpc-eabivle-gdb. This is gdb client debug console, which is used for executing gdb commands.
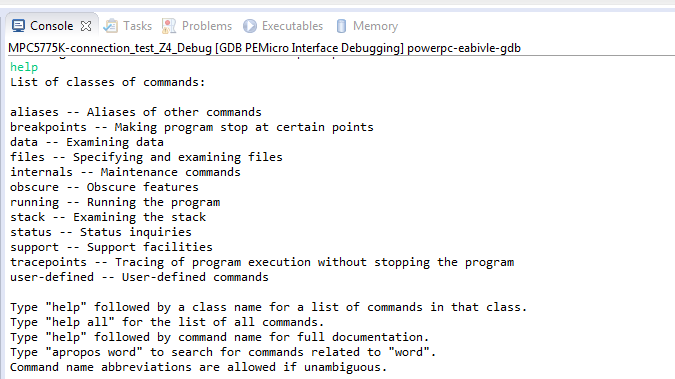
Write help to show list of classes of commands.
It is also possible to create scripts. I am not experienced in this area, but look at the following URL where you can find some useful information. Also if you use google, you will find many useful pages about gdb commands and scripting.
https://sourceware.org/gdb/onlinedocs/gdb/Command-Files.html
2) There is also a possibility to use gdb server and gdb client without S32DS IDE. You can run gdb server directly from command line (C:\Freescale\S32_Power_v1.1\eclipse\plugins\com.pemicro.debug.gdbjtag.ppc_1.3.3.201605241936\win32) and connect to the board you want to debug.
Then you run gdb client (C:\Freescale\S32_Power_v1.1\Cross_Tools\powerpc-eabivle-4_9\bin\powerpc-eabivle-gdb.exe) and connect to the running gdb server.
If you ask about tcl scripting the answer will be no. Tcl scripting is not supported in S32 Design Studio. But there is another option about scripting. If you have installed S32 Design Studio for power version 1.1, there is possibility to run .mac scripts.
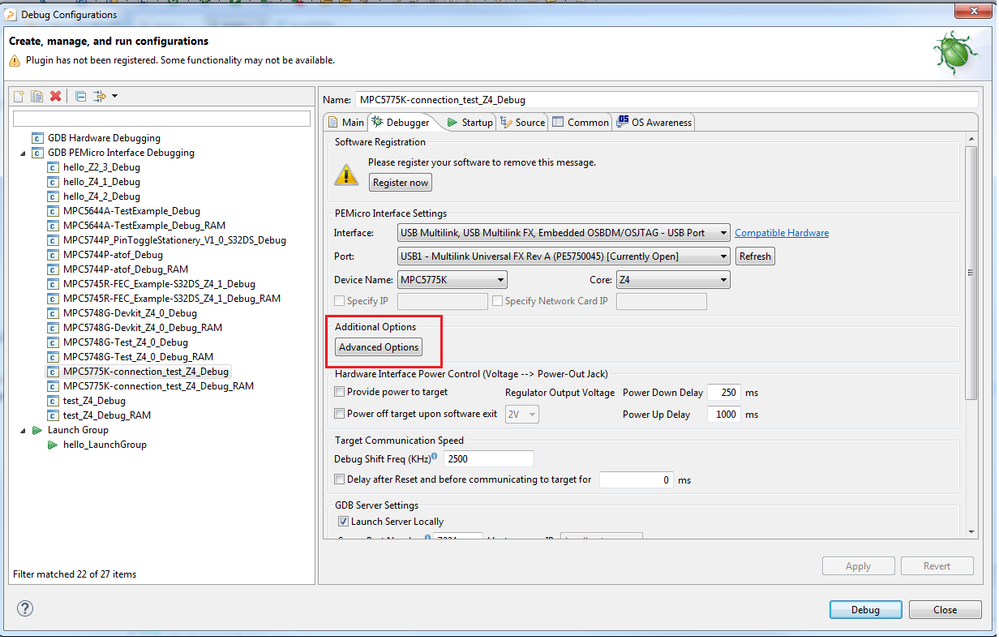
Click Debug configuration->Debugger->Advanced Options
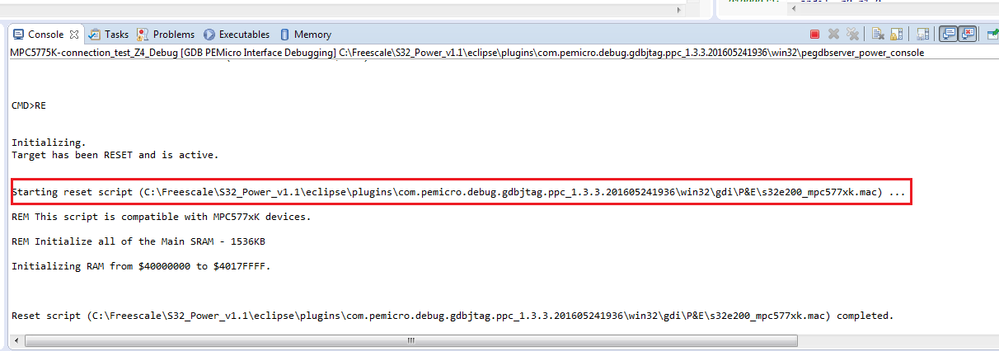
Enable Initialization script and choose the script you want to run. This script is run during initialization phase.
Executed script you see in the picture above is hard-coded (it is executed all time, but it can be changed the content of the script). When you use your own script, it should be also executed in this phase.
Regards,
Martin


