- Forums
- Product Forums
- General Purpose MicrocontrollersGeneral Purpose Microcontrollers
- i.MX Forumsi.MX Forums
- QorIQ Processing PlatformsQorIQ Processing Platforms
- Identification and SecurityIdentification and Security
- Power ManagementPower Management
- Wireless ConnectivityWireless Connectivity
- RFID / NFCRFID / NFC
- MCX Microcontrollers
- S32G
- S32K
- S32V
- MPC5xxx
- Other NXP Products
- S12 / MagniV Microcontrollers
- Powertrain and Electrification Analog Drivers
- Sensors
- Vybrid Processors
- Digital Signal Controllers
- 8-bit Microcontrollers
- ColdFire/68K Microcontrollers and Processors
- PowerQUICC Processors
- OSBDM and TBDML
- S32M
-
- Solution Forums
- Software Forums
- MCUXpresso Software and ToolsMCUXpresso Software and Tools
- CodeWarriorCodeWarrior
- MQX Software SolutionsMQX Software Solutions
- Model-Based Design Toolbox (MBDT)Model-Based Design Toolbox (MBDT)
- FreeMASTER
- eIQ Machine Learning Software
- Embedded Software and Tools Clinic
- S32 SDK
- S32 Design Studio
- GUI Guider
- Zephyr Project
- Voice Technology
- Application Software Packs
- Secure Provisioning SDK (SPSDK)
- Processor Expert Software
-
- Topics
- Mobile Robotics - Drones and RoversMobile Robotics - Drones and Rovers
- NXP Training ContentNXP Training Content
- University ProgramsUniversity Programs
- Rapid IoT
- NXP Designs
- SafeAssure-Community
- OSS Security & Maintenance
- Using Our Community
-
- Cloud Lab Forums
-
- Knowledge Bases
- ARM Microcontrollers
- i.MX Processors
- Identification and Security
- Model-Based Design Toolbox (MBDT)
- QorIQ Processing Platforms
- S32 Automotive Processing Platform
- Wireless Connectivity
- CodeWarrior
- MCUXpresso Suite of Software and Tools
- MQX Software Solutions
- RFID / NFC
-
- Home
- :
- MQXソフトウェアソリューション
- :
- MQXソフトウェアソリューションナレッジベース
- :
- Task Aware Debugging
Task Aware Debugging
- RSS フィードを購読する
- 新着としてマーク
- 既読としてマーク
- ブックマーク
- 購読
- 印刷用ページ
- 不適切なコンテンツを報告
Task Aware Debugging
Task Aware Debugging
MQX RTOS Task Aware Debugging plug-in (TAD) is an optional extension to a debugger tool which enables easy debugging of multi-tasking applications. With TAD, we can inspect task contexts and kernel objects. Typical use cases include
--view task error codes
--Examine stack usage for each task
--Examine memory usage
-- Debug TCP reception problems
--Examine socket and PCB data
--Observe memory pool / message pool utilization levels
-- Observe synchronization objects
The following is a description of MQX task aware debugger and an example to debug a stack overflow. It is based on web_hvac demo in the MQX installation folder, it also applies to other applications.
The MQX pull down menu is as below picture shows.
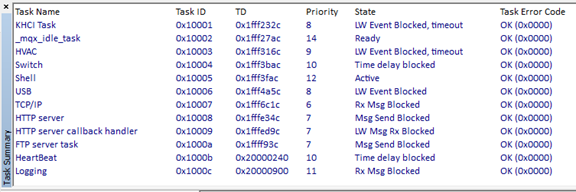
The task summary window shows all the tasks in the system, the task name , task id , task state, priority and Task error code. The idle task is also listed since this is still treated by MQX as a task, and can be helpful to know what’s happening with it.
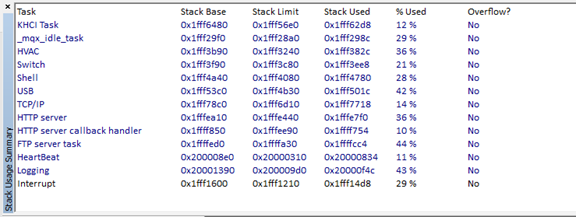
The stack usage window shows what percentage that allocated for a task interrupt have been used so far. This is a high watermark not the amount of the stack currently been used. If more than allocated stack is being used as some point, then you will see an over flow has been indicated at last column. Also for reference, the address for both the base for up and down are shown.
The kernel data window can be useful for confirming the environment you are running is actually what was loaded. You give them some key data such as the version of MQX running, the CPU, the PSP. The settings of the time component and a number of the compile time configuration settings to confirm if you have things like the kernel logging or stack monitor turned on.
The memory blocks window shows all of the blocks of memory that memory manager has currently reserved for kernel objects or application tasks. Listed is starting address for each block , the size of each block in hexadecimal , who is the owner of each block. Which can be either the system or specific tasks, and shows the type of block. We see different types such as the block for interrupts stack, system stack, task ready queue, block associated with interrupts. The logging feature, message pools etc. Down to the bottom, we see the stacks specific memory blocks including the task descriptor and task space. TAD knows what the task descriptor is so it gives all the information related to the task.
The next group of windows are related to various synchronizations that MQX supports. Such as semaphores and events ,mutexes. If some are greyed out and that because application doesn’t use it.
Example of Debugging with TAD
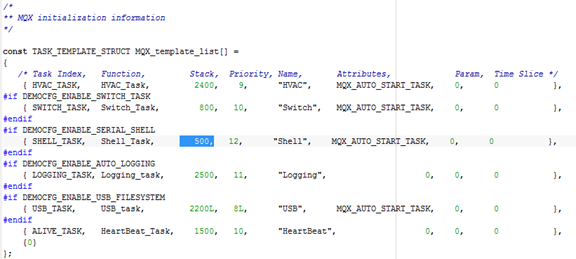
In order to gain experience using the Task Aware Debugging (TAD) feature and to learn how it can be used to debug an application, I created a stack overflow in the shell task in web_hvac demo by reducing the task stack size from 2400 to 500.
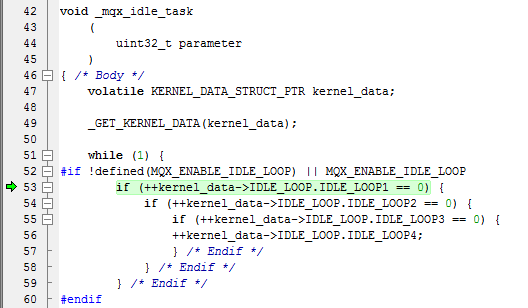
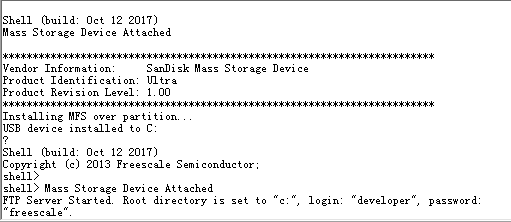
If I now run the application, we can see the application run into idle task quickly.
Opening up the stack usage window, we see that indeed an overflow was detected.
And that the stack information for the Shell task has been corrupted as a result. The task summary window also has the corrupted information for the shell task.
If you look closely, the listed tasks are short than before, and if you compare the list of tasks what you expected to be there. You noticed to shell task has completed disappear. But when we look at the console, we see that it clearly started.
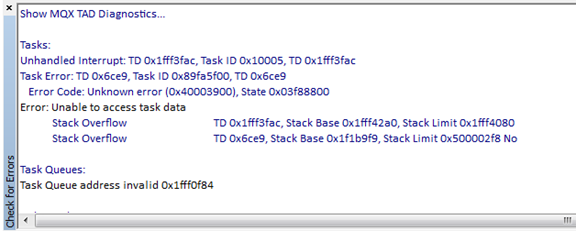
So where did it go? The stack overrun is a good clue. But also recommend scanning check for errors window.
By reviewing the task summary, stack usage and errors windows, and doing a sanity check again the states values that expecting can be very helpful ,make sure all the tasks are there. Check for error codes, and look for stack issues. To debug an application, the following steps should be follow:
- Review key TAD windows:
- Task Summary Window
- Stack Usage Window
- MQX Errors Window
- Audit various system parameters:
- Which tasks are running.
- Task states
- Check for identified errors
- Look for stack overflows
- 既読としてマーク
- 新着としてマーク
- ブックマーク
- ハイライト
- 印刷
- 不適切なコンテンツを報告
Hi Daniel,
If I use OS_Task_create does it return a task_id?
the following functions require a task id:
uint32_t OS_Task_delete(uint32_t task_id);
uint32_t OS_Task_suspend(uint32_t task_id);
uint32_t OS_Task_resume(uint32_t task_id);
I would like to suspend and then resume the task I created, but I don't know
how to get task_id?
Thanks,
Neil
- 既読としてマーク
- 新着としてマーク
- ブックマーク
- ハイライト
- 印刷
- 不適切なコンテンツを報告
Hi Neil:
Which rtos you are using? FreeRTOS, MQX , or other?
Regards
Daniel
- 既読としてマーク
- 新着としてマーク
- ブックマーク
- ハイライト
- 印刷
- 不適切なコンテンツを報告
Hi Daniel,
Its from the example in Freescale->KSDK_1.3.0->examples->frdmk64f->demo_apps->usb->host->msd->msd_fatfs
I think your familiar with it, I am not sure what they are using in this example FreeRTOS, MQX, or other?
Thanks.
- 既読としてマーク
- 新着としてマーク
- ブックマーク
- ハイライト
- 印刷
- 不適切なコンテンツを報告
Yes, I remember you are using bare mental, no os. I think these API is for a multi-task environment, not for bare mental. because there is only one task in bare-mental.
- 既読としてマーク
- 新着としてマーク
- ブックマーク
- ハイライト
- 印刷
- 不適切なコンテンツを報告
Hi Daniel,
Can you take a look at the following:
https://community.nxp.com/thread/461422
I opened up that thread in hopes you will find it.
Thanks,
Neil
- 既読としてマーク
- 新着としてマーク
- ブックマーク
- ハイライト
- 印刷
- 不適切なコンテンツを報告
OK, I will check it tomorrow, thanks for notification.
Regards
Daniel
- 既読としてマーク
- 新着としてマーク
- ブックマーク
- ハイライト
- 印刷
- 不適切なコンテンツを報告
Can anyone help me , how to integrate this plug-in in IAR workbench 6.5 and 7.5. I was looking for some easy documentation/way for this activity

