
- Forums
- Product Forums
- General Purpose MicrocontrollersGeneral Purpose Microcontrollers
- i.MX Forumsi.MX Forums
- QorIQ Processing PlatformsQorIQ Processing Platforms
- Identification and SecurityIdentification and Security
- Power ManagementPower Management
- Wireless ConnectivityWireless Connectivity
- RFID / NFCRFID / NFC
- Advanced AnalogAdvanced Analog
- Neural Processing UnitsNeural Processing Units
- MCX Microcontrollers
- S32G
- S32K
- S32V
- MPC5xxx
- Other NXP Products
- S12 / MagniV Microcontrollers
- Powertrain and Electrification Analog Drivers
- Sensors
- Vybrid Processors
- Digital Signal Controllers
- 8-bit Microcontrollers
- ColdFire/68K Microcontrollers and Processors
- PowerQUICC Processors
- OSBDM and TBDML
- S32M
- S32Z/E
-
- Solution Forums
- Software Forums
- MCUXpresso Software and ToolsMCUXpresso Software and Tools
- CodeWarriorCodeWarrior
- MQX Software SolutionsMQX Software Solutions
- Model-Based Design Toolbox (MBDT)Model-Based Design Toolbox (MBDT)
- FreeMASTER
- eIQ Machine Learning Software
- Embedded Software and Tools Clinic
- S32 SDK
- S32 Design Studio
- GUI Guider
- Zephyr Project
- Voice Technology
- Application Software Packs
- Secure Provisioning SDK (SPSDK)
- Processor Expert Software
- Generative AI & LLMs
-
- Topics
- Mobile Robotics - Drones and RoversMobile Robotics - Drones and Rovers
- NXP Training ContentNXP Training Content
- University ProgramsUniversity Programs
- Rapid IoT
- NXP Designs
- SafeAssure-Community
- OSS Security & Maintenance
- Using Our Community
-
- Cloud Lab Forums
-
- Knowledge Bases
- ARM Microcontrollers
- i.MX Processors
- Identification and Security
- Model-Based Design Toolbox (MBDT)
- QorIQ Processing Platforms
- S32 Automotive Processing Platform
- Wireless Connectivity
- CodeWarrior
- MCUXpresso Suite of Software and Tools
- MQX Software Solutions
- RFID / NFC
- Advanced Analog
- Neural Processing Units
-
- NXP Tech Blogs
- Home
- :
- MCUXpressoソフトウェアとツール
- :
- MCUXpresso IDE
- :
- Re: Trouble Debugging with J-Link
Trouble Debugging with J-Link
- RSS フィードを購読する
- トピックを新着としてマーク
- トピックを既読としてマーク
- このトピックを現在のユーザーにフロートします
- ブックマーク
- 購読
- ミュート
- 印刷用ページ
Trouble Debugging with J-Link
- 新着としてマーク
- ブックマーク
- 購読
- ミュート
- RSS フィードを購読する
- ハイライト
- 印刷
- 不適切なコンテンツを報告
Hi,
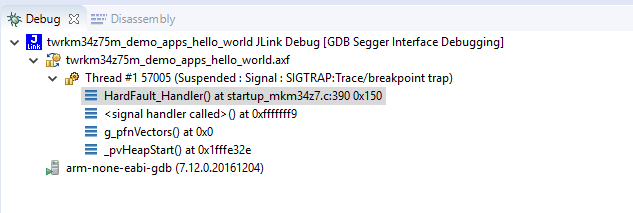
I am trying to debug my code using a Segger J-link and I seem to be getting a hard fault at startup. The same code works with the on board PE-Micro debugger.
I am using the TWR-KM34Z75M board.
Attached is the image of the call tree.
- 新着としてマーク
- ブックマーク
- 購読
- ミュート
- RSS フィードを購読する
- ハイライト
- 印刷
- 不適切なコンテンツを報告
Updating to the latest version of the J-Link software solves the problem.
Deleting all breakpoints has no effect.
- 新着としてマーク
- ブックマーク
- 購読
- ミュート
- RSS フィードを購読する
- ハイライト
- 印刷
- 不適切なコンテンツを報告
I can't see anything obvious in the logs you sent.
As previously suggested, can you try installing the latest SEGGER J-Link software (from SEGGER - The Embedded Experts - Downloads - J-Link / J-Trace ) and see if you still see the same behaviour?
It would also also be interesting to know whether you see the same behaviour if you delete all breakpoints in the Breakpoints view before you start your debug session.
Regards,
MCUXpresso IDE Support
- 新着としてマーク
- ブックマーク
- 購読
- ミュート
- RSS フィードを購読する
- ハイライト
- 印刷
- 不適切なコンテンツを報告
Setting breakpoints solving the problem sounds a little wierd. Might be interesting to see the log generated by the SEGGER software. See section 3.10, "SEGGER Troubleshooting", of the MCUXpresso IDE v10.02 User Guide.
Also are you seeing this with a standard off-the-shelf project, or is it something you have pulled together yourself?
Finally, please can you confirm what version of MCUXpresso IDE you are using, and also the version of the SEGGER software (and it might be worth installing the latest from their website too and seeing if that helps).
Regards,
MCUXpresso IDE Support
- 新着としてマーク
- ブックマーク
- 購読
- ミュート
- RSS フィードを購読する
- ハイライト
- 印刷
- 不適切なコンテンツを報告
I've attached the the logs from J-link and from GDB Server.
I first discovered the problem on my own project so I tested it on the hello world demo app with similar results.
I'm running MCUXpresso v10.0.2 [Build 411] [2017-07-11] and SEGGER J-Link V6.16b
- 新着としてマーク
- ブックマーク
- 購読
- ミュート
- RSS フィードを購読する
- ハイライト
- 印刷
- 不適切なコンテンツを報告
It seems suspicious to me that g_pfnVectors() shows up in the stack trace with an address of 0x0.
That could just be because the stack got clobbered, but can you verify that there were no linker errors? Or start single stepping from _pvHeapStart() and see where things go bad?
- 新着としてマーク
- ブックマーク
- 購読
- ミュート
- RSS フィードを購読する
- ハイライト
- 印刷
- 不適切なコンテンツを報告
Adding two break point one at 0x00000000 and one at 0x00000004 seems to fix the problem.
I'm really not sure why.
- 新着としてマーク
- ブックマーク
- 購読
- ミュート
- RSS フィードを購読する
- ハイライト
- 印刷
- 不適切なコンテンツを報告
Hi,
I would check if the device specified in the Segger connection dialog is matching your device, as this could cause a hard fault too.
Erich
- 新着としてマーク
- ブックマーク
- 購読
- ミュート
- RSS フィードを購読する
- ハイライト
- 印刷
- 不適切なコンテンツを報告
Hi Erich,
Thanks for the response.
The device specified in the Segger connection dialog is the correct device.
Based on the ARM Exception handling
Looking at the registers:
LR = 0xFFFFFFF9
MSP = 0x20005FE0 (pretty much start of stack)
xPSR = 0x61000003
Looking at the stack the previous state was:
xPSR = 0x61000000
PC = 0x00000000
LR = 0x1FFFE32F