- Forums
- Product Forums
- General Purpose MicrocontrollersGeneral Purpose Microcontrollers
- i.MX Forumsi.MX Forums
- QorIQ Processing PlatformsQorIQ Processing Platforms
- Identification and SecurityIdentification and Security
- Power ManagementPower Management
- MCX Microcontrollers
- S32G
- S32K
- S32V
- MPC5xxx
- Other NXP Products
- Wireless Connectivity
- S12 / MagniV Microcontrollers
- Powertrain and Electrification Analog Drivers
- Sensors
- Vybrid Processors
- Digital Signal Controllers
- 8-bit Microcontrollers
- ColdFire/68K Microcontrollers and Processors
- PowerQUICC Processors
- OSBDM and TBDML
- S32M
-
- Solution Forums
- Software Forums
- MCUXpresso Software and ToolsMCUXpresso Software and Tools
- CodeWarriorCodeWarrior
- MQX Software SolutionsMQX Software Solutions
- Model-Based Design Toolbox (MBDT)Model-Based Design Toolbox (MBDT)
- FreeMASTER
- eIQ Machine Learning Software
- Embedded Software and Tools Clinic
- S32 SDK
- S32 Design Studio
- GUI Guider
- Zephyr Project
- Voice Technology
- Application Software Packs
- Secure Provisioning SDK (SPSDK)
- Processor Expert Software
-
- Topics
- Mobile Robotics - Drones and RoversMobile Robotics - Drones and Rovers
- NXP Training ContentNXP Training Content
- University ProgramsUniversity Programs
- Rapid IoT
- NXP Designs
- SafeAssure-Community
- OSS Security & Maintenance
- Using Our Community
-
- Cloud Lab Forums
-
- Knowledge Bases
- ARM Microcontrollers
- i.MX Processors
- Identification and Security
- Model-Based Design Toolbox (MBDT)
- QorIQ Processing Platforms
- S32 Automotive Processing Platform
- Wireless Connectivity
- CodeWarrior
- MCUXpresso Suite of Software and Tools
- MQX Software Solutions
-
- Home
- :
- MCUXpressoソフトウェアとツール
- :
- MCUXpresso IDE
- :
- Re: MCUxpresso hangs when launching debug or build
MCUxpresso hangs when launching debug or build
- RSS フィードを購読する
- トピックを新着としてマーク
- トピックを既読としてマーク
- このトピックを現在のユーザーにフロートします
- ブックマーク
- 購読
- ミュート
- 印刷用ページ
- 新着としてマーク
- ブックマーク
- 購読
- ミュート
- RSS フィードを購読する
- ハイライト
- 印刷
- 不適切なコンテンツを報告
Launching debug, I see in the status line "Launching xxx JLink Debug s%" forever.
This is the exact same problem as: https://community.nxp.com/t5/MCUXpresso-IDE/MCUX-10-2-1-Debug-launch-freezes-at-2-for-about-a-minute...
Rebooting and trying a build,I get the same behavior then the IDE becomes non-responsive.
This started after a Windows 10 crash during a debug session.
Possibly the debug session left something lying about???
MCUXpresso version 11.3
Any idea how to unsnarl this?
Thanks!
解決済! 解決策の投稿を見る。
- 新着としてマーク
- ブックマーク
- 購読
- ミュート
- RSS フィードを購読する
- ハイライト
- 印刷
- 不適切なコンテンツを報告
Thanks @ErichStyger and @converse for the suggestions.
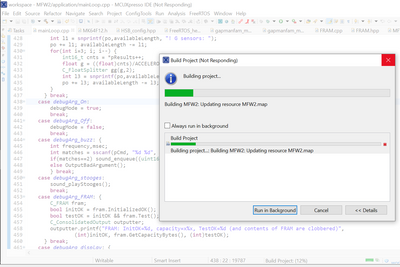
This was weird - it always hung at the "map" resource as pictured.
A 'clean' succeeded, but then the build failed again as above.
After a number of reboots and trying assorted things,
I deleted the entire "Debug" output directory,
after which build and debug proceeded as normal.
Aaarrrggggg....
Back to work now!
Best Regards, Dave
- 新着としてマーク
- ブックマーク
- 購読
- ミュート
- RSS フィードを購読する
- ハイライト
- 印刷
- 不適切なコンテンツを報告
I had the same issue and I'm not sure which, but one of these resolved the issue:
- Kill all debug components and unplug and plug back in the J-Link debug probe.
- Delete the entire Debug folder in the project's working directory.
- Closed MCUXpresso.
- Unplugged the J-Link.
- Killed the J-Link GDB server background process through Task Manager.
- Opened the J-Flash Lite GUI.
- Tried debugging a different application, like "pnev7642fama_Nfcrdlib_EMVCo_LoopBack_Freertos_Pub".
- Deleted all other Debug configurations shown in the Debug Configurations... window under the Green Debug button drop down
- and create a new configuration for the target project.
Debugging with this new configuration made worked for me.
- 新着としてマーク
- ブックマーク
- 購読
- ミュート
- RSS フィードを購読する
- ハイライト
- 印刷
- 不適切なコンテンツを報告
Thanks @ErichStyger and @converse for the suggestions.
This was weird - it always hung at the "map" resource as pictured.
A 'clean' succeeded, but then the build failed again as above.
After a number of reboots and trying assorted things,
I deleted the entire "Debug" output directory,
after which build and debug proceeded as normal.
Aaarrrggggg....
Back to work now!
Best Regards, Dave
- 新着としてマーク
- ブックマーク
- 購読
- ミュート
- RSS フィードを購読する
- ハイライト
- 印刷
- 不適切なコンテンツを報告
Hi Dave,
I call deleting the output folder a 'clean-clean'. The reason is that with auto-make it is kind of incremental: if the make files an information is screwed up somehow, it might be stuck. In that case a 'clean-clean' will help.
Erich
- 新着としてマーク
- ブックマーク
- 購読
- ミュート
- RSS フィードを購読する
- ハイライト
- 印刷
- 不適切なコンテンツを報告
Hi Dave,
a few ideas (which you might already tried, not sure), so just providing some ideas:
- does it happen for a fresh workspace for that project too? Could be that there is a lot of history information in that workspace, so a fresh one might help
- I have found https://bugs.eclipse.org/bugs/show_bug.cgi?id=387202 (rather old) which could be related: could you try to empty your recycle bin to see if this has an impact? On Windows clean as well your c:\users\<user>\AppData\LocalTemp folder
- does it happen if you do a clean first too? Or if you delete the output folder (debug?) first? I'm wondering if this is an issue with the autobuild getting stuck with the amount of your files and directories somehow.
- does the console view give any information where it is stuck: the screenshot shows a (linker) map file, so I'm wondering if this is at the end of the build?
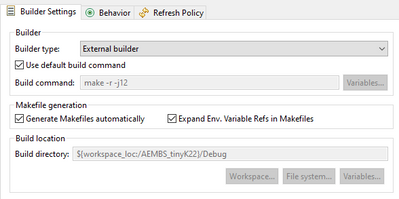
- are you using internal or external builder? Switching might change things?
I hope this helps,
Erich
- 新着としてマーク
- ブックマーク
- 購読
- ミュート
- RSS フィードを購読する
- ハイライト
- 印刷
- 不適切なコンテンツを報告
Hello,
Which MCU part do you used?
How build and debug a simple demo?
BR
Alice
- 新着としてマーク
- ブックマーク
- 購読
- ミュート
- RSS フィードを購読する
- ハイライト
- 印刷
- 不適切なコンテンツを報告
@Alice_Yang- Because this happens with a build, and not just debug, it is clearly an Eclipse issue, and not related to MCU used (K64F). A "simple demo" is not in the frame; this is a very large commercial application with ~175k lines, not ""hello world", some of us are (trying to) do actual work...
- 新着としてマーク
- ブックマーク
- 購読
- ミュート
- RSS フィードを購読する
- ハイライト
- 印刷
- 不適切なコンテンツを報告
This sounds like an issue with the Indexer (the thing that parses your source files and gives you things like auto-complete and finding references etc). You may try switching it off (to confirm it is this causing the problem) and (once confirmed), playing with the configuration to try to improve the speed.
See Preferences->C/C++->Indexer

