- Forums
- Product Forums
- General Purpose MicrocontrollersGeneral Purpose Microcontrollers
- i.MX Forumsi.MX Forums
- QorIQ Processing PlatformsQorIQ Processing Platforms
- Identification and SecurityIdentification and Security
- Power ManagementPower Management
- Wireless ConnectivityWireless Connectivity
- RFID / NFCRFID / NFC
- MCX Microcontrollers
- S32G
- S32K
- S32V
- MPC5xxx
- Other NXP Products
- S12 / MagniV Microcontrollers
- Powertrain and Electrification Analog Drivers
- Sensors
- Vybrid Processors
- Digital Signal Controllers
- 8-bit Microcontrollers
- ColdFire/68K Microcontrollers and Processors
- PowerQUICC Processors
- OSBDM and TBDML
- S32M
-
- Solution Forums
- Software Forums
- MCUXpresso Software and ToolsMCUXpresso Software and Tools
- CodeWarriorCodeWarrior
- MQX Software SolutionsMQX Software Solutions
- Model-Based Design Toolbox (MBDT)Model-Based Design Toolbox (MBDT)
- FreeMASTER
- eIQ Machine Learning Software
- Embedded Software and Tools Clinic
- S32 SDK
- S32 Design Studio
- GUI Guider
- Zephyr Project
- Voice Technology
- Application Software Packs
- Secure Provisioning SDK (SPSDK)
- Processor Expert Software
-
- Topics
- Mobile Robotics - Drones and RoversMobile Robotics - Drones and Rovers
- NXP Training ContentNXP Training Content
- University ProgramsUniversity Programs
- Rapid IoT
- NXP Designs
- SafeAssure-Community
- OSS Security & Maintenance
- Using Our Community
-
- Cloud Lab Forums
-
- Knowledge Bases
- ARM Microcontrollers
- i.MX Processors
- Identification and Security
- Model-Based Design Toolbox (MBDT)
- QorIQ Processing Platforms
- S32 Automotive Processing Platform
- Wireless Connectivity
- CodeWarrior
- MCUXpresso Suite of Software and Tools
- MQX Software Solutions
- RFID / NFC
-
- Home
- :
- MCUXpressoソフトウェアとツール
- :
- MCUXpresso IDE
- :
- MCUXpresso does not discover JLink probe
MCUXpresso does not discover JLink probe
- RSS フィードを購読する
- トピックを新着としてマーク
- トピックを既読としてマーク
- このトピックを現在のユーザーにフロートします
- ブックマーク
- 購読
- ミュート
- 印刷用ページ
- 新着としてマーク
- ブックマーク
- 購読
- ミュート
- RSS フィードを購読する
- ハイライト
- 印刷
- 不適切なコンテンツを報告
I am using MCUXpresso IDE v10.2.1 [Build 795] [2018-07-25]. I have a SEGGER JLink Ultra+ debug probe.
JLink_V640 Installed on my PC running Windows 10
Using SEGGER SystemView as well as JLinkRTTViewer works just fine so I know the probe enumerates correctly and the PC can talk to it.
In MCUXpresso, in the "Debug your project" options in the Quickstart panel, I click the JLink Icon and "Debug using SEGGER J-Link probes".
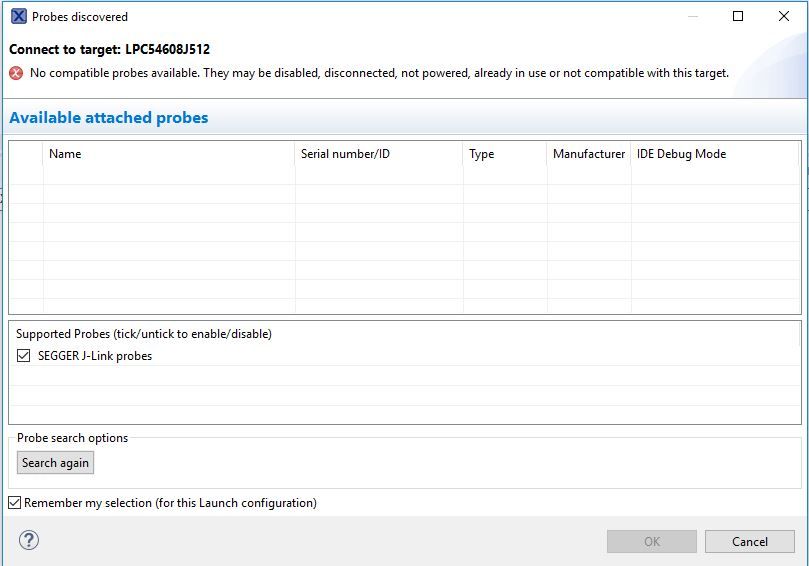
The dialog box shows up and says "No compatible probes available. They may be disabled, disconnected, not powered, already in use or not compatible with this target."
Here is the console output:
[Started server]
[Connected on port 3025]
redlink> ProbeList
No probes found
redlink> ProbeList
No probes found
redlink> ProbeList
No probes found
redlink> ProbeStatus
redlink> quit
[Closed]
I have the LPCXpresso546 eval board as well that has a JLink debugger and it does not find that either. My project nor any example SDK project seems to work.
解決済! 解決策の投稿を見る。
- 新着としてマーク
- ブックマーク
- 購読
- ミュート
- RSS フィードを購読する
- ハイライト
- 印刷
- 不適切なコンテンツを報告
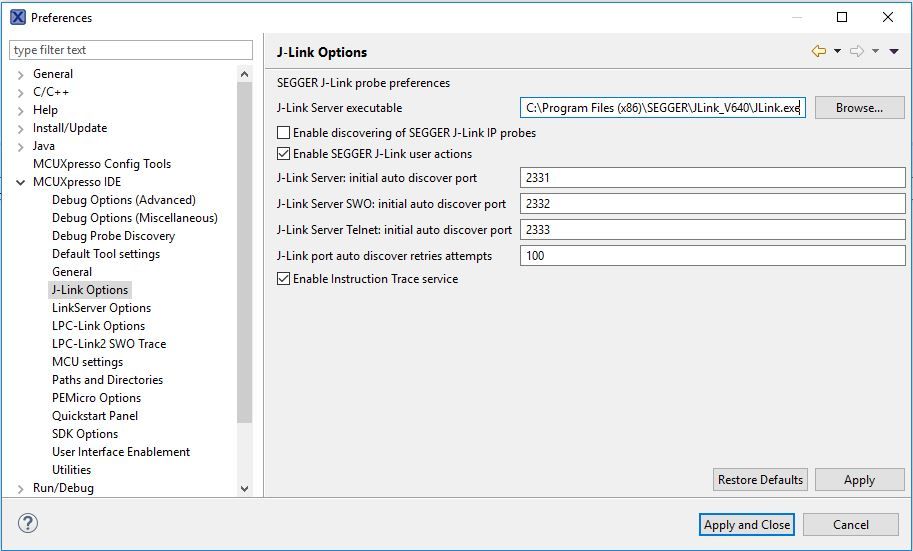
So looking at your screenshot of the IDE Preferences, I can see that for some reason you are pointing at the wrong executable - probably as a result of manually editing the option. You should be pointing at "JLinkGDBServerCL.exe".
On the assumption that v6.40 is the latest SEGGER software install on your machine, and it is in the default location, then the IDE should automatically find the right file and correctly set the preference if you just click on the "Restore Defaults" button at the bottom of the J-Link Options page of the IDE Preferences.
Hopefully you should then be up and running.
Regards,
MCUXpresso IDE Support
- 新着としてマーク
- ブックマーク
- 購読
- ミュート
- RSS フィードを購読する
- ハイライト
- 印刷
- 不適切なコンテンツを報告
You lead me to the answer. In the IDE preferences for the J-Link, the "J-Link server executable" was wrong. It was pointing to the JLink.exe and not the JLinkGDBServerCL.exe. The MCUXpresso users guide Section 4.10.1 shows it as the JLinkGDBServerCL.exe.
Not sure how that happened because I never new that setting existed till you told me, so I didn't change it. It must have changed somehow when I updated to the latest MCUXpresso or the latest JLink_V640?
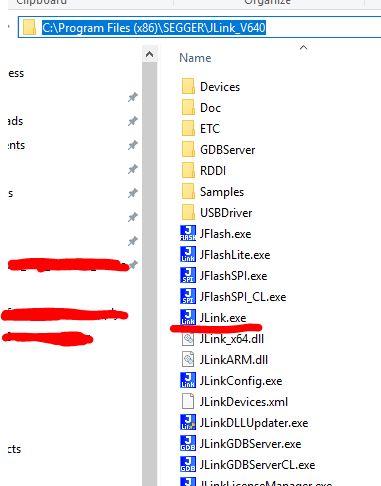
Below is the correct executable path. And the IDE now finds my JLink probe
- 新着としてマーク
- ブックマーク
- 購読
- ミュート
- RSS フィードを購読する
- ハイライト
- 印刷
- 不適切なコンテンツを報告
The IDE invokes the SEGGER supplied GDBserver to request a list of attached J-Link probes. The information this returns is then parsed by the IDE for display within the probe discovery mechanism. We've certainly never seen any issues similar to what you describe with this process.
Can you confirm the IDE preferences regarding the version of the SEGGER software being used for your workspace? See section 4.10.1, "SEGGER software installation" of the MCUXpresso IDE v10.2.1 User Guide for more details of this.
It would be interesting to know if you continue to see problems if you reselect the version of SEGGER's software that was supplied with MCUXpresso IDE v10.2.1 (v6.32h)
Anyway, if you are continuing to see problems, can you please ZIP up and post the .log file from inside the .metadata folder inside your workspace - this may provide some clues as to what is going wrong.
[Note : the console output you have provided is the one for LinkServer, hence not relevant for J-Link debugging]
Regards,
MCUXpresso IDE Support
- 新着としてマーク
- ブックマーク
- 購読
- ミュート
- RSS フィードを購読する
- ハイライト
- 印刷
- 不適切なコンテンツを報告
Here is my IDE preferences for JLink.
I did confirm that the file does exist
I downloaded and installed JLink_V632, JLink_V632i, and JLink_V620C. Then tried each one by changing the path to the JLink.exe file in the IDE preferences. All of them did not work and gave the same error of not finding a compatible probe. I have no other programs running that use the JLink probe or GDB.
Attached is the log file for when I tried to discover a probe with the IDE configured to use the JLink_V640.


