- Forums
- Product Forums
- General Purpose MicrocontrollersGeneral Purpose Microcontrollers
- i.MX Forumsi.MX Forums
- QorIQ Processing PlatformsQorIQ Processing Platforms
- Identification and SecurityIdentification and Security
- Power ManagementPower Management
- MCX Microcontrollers
- S32G
- S32K
- S32V
- MPC5xxx
- Other NXP Products
- Wireless Connectivity
- S12 / MagniV Microcontrollers
- Powertrain and Electrification Analog Drivers
- Sensors
- Vybrid Processors
- Digital Signal Controllers
- 8-bit Microcontrollers
- ColdFire/68K Microcontrollers and Processors
- PowerQUICC Processors
- OSBDM and TBDML
- S32M
-
- Solution Forums
- Software Forums
- MCUXpresso Software and ToolsMCUXpresso Software and Tools
- CodeWarriorCodeWarrior
- MQX Software SolutionsMQX Software Solutions
- Model-Based Design Toolbox (MBDT)Model-Based Design Toolbox (MBDT)
- FreeMASTER
- eIQ Machine Learning Software
- Embedded Software and Tools Clinic
- S32 SDK
- S32 Design Studio
- GUI Guider
- Zephyr Project
- Voice Technology
- Application Software Packs
- Secure Provisioning SDK (SPSDK)
- Processor Expert Software
- MCUXpresso Training Hub
-
- Topics
- Mobile Robotics - Drones and RoversMobile Robotics - Drones and Rovers
- NXP Training ContentNXP Training Content
- University ProgramsUniversity Programs
- Rapid IoT
- NXP Designs
- SafeAssure-Community
- OSS Security & Maintenance
- Using Our Community
-
- Cloud Lab Forums
-
- Knowledge Bases
- ARM Microcontrollers
- i.MX Processors
- Identification and Security
- Model-Based Design Toolbox (MBDT)
- QorIQ Processing Platforms
- S32 Automotive Processing Platform
- Wireless Connectivity
- CodeWarrior
- MCUXpresso Suite of Software and Tools
- MQX Software Solutions
-
- Home
- :
- MCUXpresso软件和工具
- :
- MCUXpresso IDE
- :
- Re: LPC-Link2 Could not connect to core
LPC-Link2 Could not connect to core
Hello! We have created the first LPCOpen project for LPC-Link2 and now we have problems with its connection to MCUXpresso. When debugging starts, we get the following errors.
In the console:
MCUXpresso RedlinkMulti Driver v10.0 (Jun 22 2017 23:31:55 - crt_emu_cm_redlink build 272)
Reconnected to existing redlink server (PID 4294967295)
Connecting to probe 1 core 0 (server PID unknown) gave 'Ee(36). Could not connect to core.'
Connecting to probe 1 core 0 (server PID unknown) gave 'Ee(36). Could not connect to core.'
Connecting to probe 1 core 0 (server PID unknown) gave 'Ee(36). Could not connect to core.'
Server OK but no connection to probe 1 core 0 (after 3 attempts) - Ee(36). Could not connect to core.
Failed on connect: Ee(36). Could not connect to core.
No connection to chip's debug port
error closing down debug session - Em(02). MEM-AP is not selected.
In the message box:
Error in final launch sequence
Failed to execute MI command:
-target-select extended-remote | crt_emu_cm_redlink -msg-port=52478 -g -mi -2 -pLPC4370 -vendor=NXP -ResetScript=LPC18LPC43ExternalFLASHBootResetscript.scp -reset= -ProbeHandle=1 -CoreIndex=0 -cache=disable --telnet 3332
Error message from debugger back end:
Remote communication error. Target disconnected.: No error.
Remote communication error. Target disconnected.: No error.
Jumper JP1 and JP2 are open. Tell me please, what are we doing wrong?
已解决! 转到解答。
Yes, you can use a J-Link to debug the LPC-Link2, or, another LPC-Link2. I guess it wasn’t clear what you were trying to do, but the LPC-Link2 can’t debug itself. You need a separate probe.
Thanks and regards,
MCUXpresso Support
Yes, you can use a J-Link to debug the LPC-Link2, or, another LPC-Link2. I guess it wasn’t clear what you were trying to do, but the LPC-Link2 can’t debug itself. You need a separate probe.
Thanks and regards,
MCUXpresso Support
This very much sounds like you are trying to debug your LPC-Link2 using the same LPC-Link2? You cannot do this - the LPC-Link2 cannot act as both a debug probe and a target board at the same time.
If you do have a separate target board - what is the target board, what MCU does it have fitted, how are you powering it, and how are you connecting it to the LPC-Link2?
Regards,
MCUXpresso IDE Support
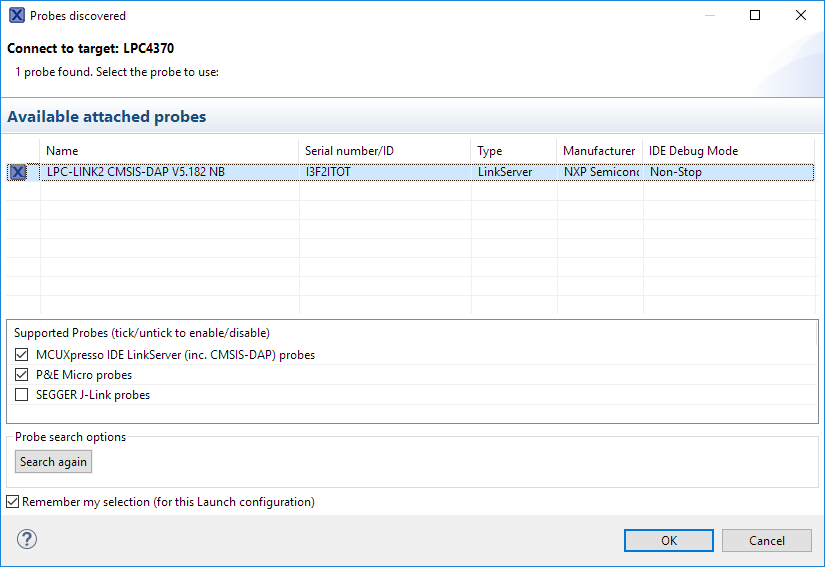
It almost sounds like your probe hasn't booted. The MCUXpresso IDE will DFU boot the probe if it's not found. Delete your launch configurations, and power cycle your probe. Be certain no rogue redlinkserv, crt_emu_cm_redlink, or arm-none-eabi-gdb processes are running. If the probe boots successfully, the IDE will show the probe details for you to select. Let us know what you find.
Thanks and regards,
MCUXpresso Support
1. If I understand you correctly, then here is the window that appeared after all the actions done and start debugging.
2. I have Segger J-Link programmer. Can I use it for debugging of LPC-Link2 board?
