- Forums
- Product Forums
- General Purpose MicrocontrollersGeneral Purpose Microcontrollers
- i.MX Forumsi.MX Forums
- QorIQ Processing PlatformsQorIQ Processing Platforms
- Identification and SecurityIdentification and Security
- Power ManagementPower Management
- Wireless ConnectivityWireless Connectivity
- RFID / NFCRFID / NFC
- Advanced AnalogAdvanced Analog
- MCX Microcontrollers
- S32G
- S32K
- S32V
- MPC5xxx
- Other NXP Products
- S12 / MagniV Microcontrollers
- Powertrain and Electrification Analog Drivers
- Sensors
- Vybrid Processors
- Digital Signal Controllers
- 8-bit Microcontrollers
- ColdFire/68K Microcontrollers and Processors
- PowerQUICC Processors
- OSBDM and TBDML
- S32M
- S32Z/E
-
- Solution Forums
- Software Forums
- MCUXpresso Software and ToolsMCUXpresso Software and Tools
- CodeWarriorCodeWarrior
- MQX Software SolutionsMQX Software Solutions
- Model-Based Design Toolbox (MBDT)Model-Based Design Toolbox (MBDT)
- FreeMASTER
- eIQ Machine Learning Software
- Embedded Software and Tools Clinic
- S32 SDK
- S32 Design Studio
- GUI Guider
- Zephyr Project
- Voice Technology
- Application Software Packs
- Secure Provisioning SDK (SPSDK)
- Processor Expert Software
- Generative AI & LLMs
-
- Topics
- Mobile Robotics - Drones and RoversMobile Robotics - Drones and Rovers
- NXP Training ContentNXP Training Content
- University ProgramsUniversity Programs
- Rapid IoT
- NXP Designs
- SafeAssure-Community
- OSS Security & Maintenance
- Using Our Community
-
- Cloud Lab Forums
-
- Knowledge Bases
- ARM Microcontrollers
- i.MX Processors
- Identification and Security
- Model-Based Design Toolbox (MBDT)
- QorIQ Processing Platforms
- S32 Automotive Processing Platform
- Wireless Connectivity
- CodeWarrior
- MCUXpresso Suite of Software and Tools
- MQX Software Solutions
- RFID / NFC
- Advanced Analog
-
- NXP Tech Blogs
- Home
- :
- General Purpose Microcontrollers
- :
- LPC Microcontrollers
- :
- LPC845 strange debug behavior with IAR & J-Link
LPC845 strange debug behavior with IAR & J-Link
- Subscribe to RSS Feed
- Mark Topic as New
- Mark Topic as Read
- Float this Topic for Current User
- Bookmark
- Subscribe
- Mute
- Printer Friendly Page
LPC845 strange debug behavior with IAR & J-Link
- Mark as New
- Bookmark
- Subscribe
- Mute
- Subscribe to RSS Feed
- Permalink
- Report Inappropriate Content
Hi,
I met some strange behavior when debugging the LPCXpresso845MAX board with J-Link (v6.32i) and IAR 8.22, on board debugger is disabled by JP1.
I'm using the blinky demo, here is what I did :
1.Without the debugger the program run correctly, when debug session is launched, PC went to 0xfffffffc when SysTick exception is raised. In IPSR register exception number is 3 which is hardfault, but hardfault handler is not entered(hardfault handler address is in intvec and SCB->VTOR is 0).
2.I enabled vector catch, when SysTick exception is raised PC went to 0x00000000 .
3.Just for curious, I wanted to try what would happen if intvec is copied to ram:
3a. In linker file a intvec area is reserved:
define symbol r_interrupts_start = 0x10000000;
define symbol r_interrupts_end = 0x100000BF;define symbol m_data_start = 0x100000C0;
define symbol m_data_end = 0x10003FFF - __size_cstack__;define region RAM_INTVEC_region = mem:[from r_interrupts_start to r_interrupts_end];
3b. SystemInit is modified:
void SystemInit (void)
{
register uint32_t* src = (uint32_t*)0x00000000;
register uint32_t* dst = (uint32_t*)0x10000000;
for(uint32_t i = 0; i < 0x30; i++)
{
*dst++ = *src++;
}
SCB->VTOR = 0x10000000;
SystemCoreClock = DEFAULT_SYSTEM_CLOCK;
SystemInitHook();
}
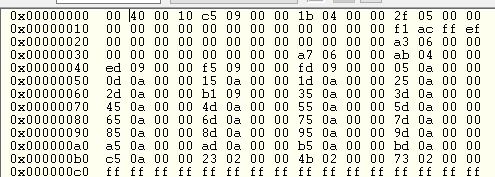
3c. To my suprise, the copied value is the bottom of bootROM ! But the intvec in 0x00000000 is correct :
4.It seems like something went wrong when the debugger is attached, according to the manual boot block is also visible at 0x00000000, maybe the mcu believed the last 512 byte of bootROM is intvec and hardfault happened when an exception is raised, since it can't find the handler address hardfault is raised and PC went to 0x00000000 ?
- Mark as New
- Bookmark
- Subscribe
- Mute
- Subscribe to RSS Feed
- Permalink
- Report Inappropriate Content
Hi Zixun LI,
I ran the blinky demo from the SDK 2.4.2 using IAR Embedded Workbench IDE 8.20.2 and I had no issue debugging the demo. I'm also using J-link for ARM debugger (V6.32b).
However, I recommend you to boot into ISP mode to try to recover debug access. Please refer to the following thread.
Regaining debug access to target MCU
Best regards,
Felipe.


