
- Forums
- Product Forums
- General Purpose MicrocontrollersGeneral Purpose Microcontrollers
- i.MX Forumsi.MX Forums
- QorIQ Processing PlatformsQorIQ Processing Platforms
- Identification and SecurityIdentification and Security
- Power ManagementPower Management
- Wireless ConnectivityWireless Connectivity
- RFID / NFCRFID / NFC
- Advanced AnalogAdvanced Analog
- Neural Processing UnitsNeural Processing Units
- MCX Microcontrollers
- S32G
- S32K
- S32V
- MPC5xxx
- Other NXP Products
- S12 / MagniV Microcontrollers
- Powertrain and Electrification Analog Drivers
- Sensors
- Vybrid Processors
- Digital Signal Controllers
- 8-bit Microcontrollers
- ColdFire/68K Microcontrollers and Processors
- PowerQUICC Processors
- OSBDM and TBDML
- S32M
- S32Z/E
-
- Solution Forums
- Software Forums
- MCUXpresso Software and ToolsMCUXpresso Software and Tools
- CodeWarriorCodeWarrior
- MQX Software SolutionsMQX Software Solutions
- Model-Based Design Toolbox (MBDT)Model-Based Design Toolbox (MBDT)
- FreeMASTER
- eIQ Machine Learning Software
- Embedded Software and Tools Clinic
- S32 SDK
- S32 Design Studio
- GUI Guider
- Zephyr Project
- Voice Technology
- Application Software Packs
- Secure Provisioning SDK (SPSDK)
- Processor Expert Software
- Generative AI & LLMs
-
- Topics
- Mobile Robotics - Drones and RoversMobile Robotics - Drones and Rovers
- NXP Training ContentNXP Training Content
- University ProgramsUniversity Programs
- Rapid IoT
- NXP Designs
- SafeAssure-Community
- OSS Security & Maintenance
- Using Our Community
-
- Cloud Lab Forums
-
- Knowledge Bases
- ARM Microcontrollers
- i.MX Processors
- Identification and Security
- Model-Based Design Toolbox (MBDT)
- QorIQ Processing Platforms
- S32 Automotive Processing Platform
- Wireless Connectivity
- CodeWarrior
- MCUXpresso Suite of Software and Tools
- MQX Software Solutions
- RFID / NFC
- Advanced Analog
- Neural Processing Units
-
- NXP Tech Blogs
- Home
- :
- General Purpose Microcontrollers
- :
- LPC Microcontrollers
- :
- JTAG device scan problems
JTAG device scan problems
Turn on suggestions
Auto-suggest helps you quickly narrow down your search results by suggesting possible matches as you type.
Options
- Subscribe to RSS Feed
- Mark Topic as New
- Mark Topic as Read
- Float this Topic for Current User
- Bookmark
- Subscribe
- Mute
- Printer Friendly Page
JTAG device scan problems
06-15-2016
11:51 AM
5,171 Views
NXP Employee
- Mark as New
- Bookmark
- Subscribe
- Mute
- Subscribe to RSS Feed
- Permalink
- Report Inappropriate Content
Content originally posted in LPCWare by Flo on Mon Mar 31 04:37:52 MST 2014
Hi there,
I am using a LPC4357 (Embedded Artists OEM Module) with Red Suite 5 and the Red Probe+. Recently I can't use the JTAG interface for debugging anymore (it was always used for debugging the Cortex M0).
It looks like the Debug Probe is not able to scan/find the devices correctly. There appears a list with 7 entries and the Cortex M0 entry is splitted up (as you can see in the attached image).
I still can programm both cores and also debugging the Cortex M4 using the SWD-Interface still works. The applications also execute regulary. I already created new debug configurations reloaded/reset the firmware to see if the issue lies there but nothing helped. The module is in use for almost one year now, so I don't think it is a configuration problem. May the MCU be damaged?
Best regards,
Flo
6 Replies
06-15-2016
11:51 AM
5,120 Views
NXP Employee
- Mark as New
- Bookmark
- Subscribe
- Mute
- Subscribe to RSS Feed
- Permalink
- Report Inappropriate Content
Content originally posted in LPCWare by Flo on Thu Apr 03 06:39:35 MST 2014
I just organized a LPC-Link and checked the JTAG chain on the OEM board. The LPC-Link also finds the "incorrect" device list. I also tested the Red Probe+ on another target. It works fine.
So I'll buy a new OEM Board, Or is there a way to fix it?
Regards,
Flo
I just organized a LPC-Link and checked the JTAG chain on the OEM board. The LPC-Link also finds the "incorrect" device list. I also tested the Red Probe+ on another target. It works fine.
So I'll buy a new OEM Board, Or is there a way to fix it?
Regards,
Flo
06-15-2016
11:51 AM
5,120 Views
NXP Employee
- Mark as New
- Bookmark
- Subscribe
- Mute
- Subscribe to RSS Feed
- Permalink
- Report Inappropriate Content
Content originally posted in LPCWare by lpcxpresso-support on Tue Apr 01 21:35:38 MST 2014
This sounds inconclusive. The VIL for 3V3 CMOS logic is 0.8V, so 0.7V is technically below the threshold.
Can your Red Probe+ successfully interrogate the JTAG scan chain on any other target? If not, it might pay to remove the cover screws on the Red Probe+ and double check the cable connections.
Regards,
LPCXpresso-Support
06-15-2016
11:51 AM
5,120 Views
NXP Employee
- Mark as New
- Bookmark
- Subscribe
- Mute
- Subscribe to RSS Feed
- Permalink
- Report Inappropriate Content
Content originally posted in LPCWare by Flo on Tue Apr 01 05:21:15 MST 2014
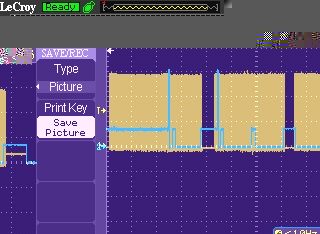
Actually not, but I used a scope to take a look at the signals. It shows that the TDI line is not always on 0V or 3.3V (This is what i would expect due to the pullups/-downs).
Unfortunetly the line is at ~0.7V sometimes. I attached a sample screenshot with CLK and TDI. Is there a consequence that can be drawn out of this behaviour (damaged MCU or Debug Probe)?
06-15-2016
11:51 AM
5,120 Views
NXP Employee
- Mark as New
- Bookmark
- Subscribe
- Mute
- Subscribe to RSS Feed
- Permalink
- Report Inappropriate Content
Content originally posted in LPCWare by lpcxpresso-support on Mon Mar 31 23:57:42 MST 2014
Can you try a different debug probe? Another Red Probe+, or a LPC-Link or LPC-Link2?
Can you try a different debug probe? Another Red Probe+, or a LPC-Link or LPC-Link2?
06-15-2016
11:51 AM
5,120 Views
NXP Employee
- Mark as New
- Bookmark
- Subscribe
- Mute
- Subscribe to RSS Feed
- Permalink
- Report Inappropriate Content
Content originally posted in LPCWare by Flo on Mon Mar 31 07:02:58 MST 2014
- Nothing has been added to the JTAG chain
- I tried the scan without my JTAG adapter cable adapter (so I used the original connector of the Red Probe+ on the EA LPC4357 DevKit). The scan result is the same as before this way.
- Recreation of debug configuration: Doesn't help.
- I booted the MCU in ISP mode and started JTAG: Same result as before.
06-15-2016
11:51 AM
5,120 Views
NXP Employee
- Mark as New
- Bookmark
- Subscribe
- Mute
- Subscribe to RSS Feed
- Permalink
- Report Inappropriate Content
Content originally posted in LPCWare by lpcxpresso-support on Mon Mar 31 05:55:24 MST 2014
A few suggestions/things to try
- has anything been added to the JTAG scan chain? Perhaps for boundary scan or test purposes
- have you tried changing the (JTAG) cable?
- try deleting and recreating the debug configuration
- try booting the device in ISP mode
Let us know of your results
A few suggestions/things to try
- has anything been added to the JTAG scan chain? Perhaps for boundary scan or test purposes
- have you tried changing the (JTAG) cable?
- try deleting and recreating the debug configuration
- try booting the device in ISP mode
Let us know of your results