- Forums
- Product Forums
- General Purpose MicrocontrollersGeneral Purpose Microcontrollers
- i.MX Forumsi.MX Forums
- QorIQ Processing PlatformsQorIQ Processing Platforms
- Identification and SecurityIdentification and Security
- Power ManagementPower Management
- Wireless ConnectivityWireless Connectivity
- RFID / NFCRFID / NFC
- MCX Microcontrollers
- S32G
- S32K
- S32V
- MPC5xxx
- Other NXP Products
- S12 / MagniV Microcontrollers
- Powertrain and Electrification Analog Drivers
- Sensors
- Vybrid Processors
- Digital Signal Controllers
- 8-bit Microcontrollers
- ColdFire/68K Microcontrollers and Processors
- PowerQUICC Processors
- OSBDM and TBDML
- S32M
-
- Solution Forums
- Software Forums
- MCUXpresso Software and ToolsMCUXpresso Software and Tools
- CodeWarriorCodeWarrior
- MQX Software SolutionsMQX Software Solutions
- Model-Based Design Toolbox (MBDT)Model-Based Design Toolbox (MBDT)
- FreeMASTER
- eIQ Machine Learning Software
- Embedded Software and Tools Clinic
- S32 SDK
- S32 Design Studio
- GUI Guider
- Zephyr Project
- Voice Technology
- Application Software Packs
- Secure Provisioning SDK (SPSDK)
- Processor Expert Software
-
- Topics
- Mobile Robotics - Drones and RoversMobile Robotics - Drones and Rovers
- NXP Training ContentNXP Training Content
- University ProgramsUniversity Programs
- Rapid IoT
- NXP Designs
- SafeAssure-Community
- OSS Security & Maintenance
- Using Our Community
-
- Cloud Lab Forums
-
- Knowledge Bases
- ARM Microcontrollers
- i.MX Processors
- Identification and Security
- Model-Based Design Toolbox (MBDT)
- QorIQ Processing Platforms
- S32 Automotive Processing Platform
- Wireless Connectivity
- CodeWarrior
- MCUXpresso Suite of Software and Tools
- MQX Software Solutions
-
- Home
- :
- 通用微控制器
- :
- Kinetis微控制器
- :
- Re: isr_vctor in KDS
isr_vector in KDS
Hi,
I'm working on a project in Kinetis Design Studio using a SEGGER J-Link debugger. Now, when I run the application, KDS seemingly randomly after some time jumps to a tab that reads "isr_vector" and only shows "No source available for "__isr_vector() at 0x0" and a [View Disassembly...] button (which clicked only shows a dotted line in the Disassemby window. Sometimes, the application keeps running as if nothing had happened while other times it does stop. There is a debug console hooked up to UART0 and an RFID reader to UART4 and nothing else should be active. How do I best go about finding the seemingly misconfigured isr vector?
已解决! 转到解答。
Hi,
I can't think of any smart way to debug. If you believe this is caused by isr, you can toggle a gpio when in/out interrupt service code. Then shrink the position till find the problem.
Regards,
Jing
Hi stderr,
When you go into debug mode, does the disassembly window display dotted line at address 0x0? It display something like "movs r0,r0" in my demo project.
SCB->VTOR register assign the vector table start address.
And you can check NVIC-> ISER(interrupt set enable register at 0xe000e100) and NVIC->ISPR(interrupt set pending register at 0xe000e200) to see what interrupt is happening.
Regards,
Jing
Hi Jing,
Thanks for the reply:
@jingpan wrote:Hi stderr,
When you go into debug mode, does the disassembly window display dotted line at address 0x0? It display something like "movs r0,r0" in my demo project.
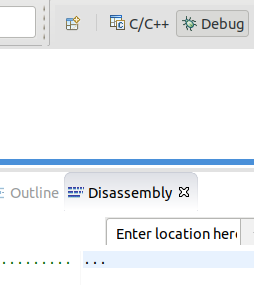
Yes, all I see is:
@jingpan wrote:SCB->VTOR register assign the vector table start address.
And you can check NVIC-> ISER(interrupt set enable register at 0xe000e100) and NVIC->ISPR(interrupt set pending register at 0xe000e200) to see what interrupt is happening.
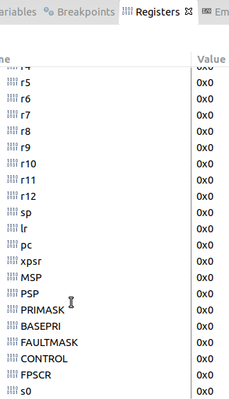
There is no SCB or NVIC register, the only ones I see are:
s0 is followed up with registers up to s31.
One thing I found it, that the sp register reads:
Name : sp
	Hex:0x0
	Decimal:0
	Octal:0
	Binary:0
	Default:0x0 <__isr_vector>
when I click on it, also the pc looks like:
Name : pc
	Hex:0x0
	Decimal:0
	Octal:0
	Binary:0
	Default:0x0 <__isr_vector>
all others just show 0s which I find odd.
I have the same situation now, KDS stopped, "No source available for "__isr_vector() at 0x0", All registers are 0x0 but in the disassembly window I now have:
00000000:   Failed to execute MI command:
          -data-disassemble -s 0 -e 140 -- 3
          Error message from debugger back end:
          Cannot access memory at address 0x0
00000001:   Failed to execute MI command:
          -data-disassemble -s 1 -e 77 -- 3
          Error message from debugger back end:
          Cannot access memory at address 0x0
00000002:   Failed to execute MI command:
          -data-disassemble -s 2 -e 78 -- 3
          Error message from debugger back end:
          Cannot access memory at address 0x2
00000003:   Failed to execute MI command:
          -data-disassemble -s 3 -e 79 -- 3
          Error message from debugger back end:
          Cannot access memory at address 0x2
00000004:   Failed to execute MI command:
          -data-disassemble -s 4 -e 80 -- 3
          Error message from debugger back end:
          Cannot access memory at address 0x4
00000005:   Failed to execute MI command:
          -data-disassemble -s 5 -e 81 -- 3
          Error message from debugger back end:
          Cannot access memory at address 0x4
00000006:   Failed to execute MI command:
          -data-disassemble -s 6 -e 82 -- 3
          Error message from debugger back end:
          Cannot access memory at address 0x6
00000007:   Failed to execute MI command:
          -data-disassemble -s 7 -e 83 -- 3
          Error message from debugger back end:
          Cannot access memory at address 0x6
00000008:   Failed to execute MI command:
          -data-disassemble -s 8 -e 84 -- 3
          Error message from debugger back end:
          Cannot access memory at address 0x8
00000009:   Failed to execute MI command:
          -data-disassemble -s 9 -e 85 -- 3
          Error message from debugger back end:
          Cannot access memory at address 0x8
0000000a:   Failed to execute MI command:
          -data-disassemble -s 10 -e 86 -- 3
          Error message from debugger back end:
          Cannot access memory at address 0xa
0000000b:   Failed to execute MI command:
          -data-disassemble -s 11 -e 87 -- 3
          Error message from debugger back end:
          Cannot access memory at address 0xa
0000000c:   Failed to execute MI command:
          -data-disassemble -s 12 -e 88 -- 3
          Error message from debugger back end:
          Cannot access memory at address 0xc
0000000d:   Failed to execute MI command:
          -data-disassemble -s 13 -e 89 -- 3
          Error message from debugger back end:
          Cannot access memory at address 0xc
0000000e:   Failed to execute MI command:
          -data-disassemble -s 14 -e 90 -- 3
          Error message from debugger back end:
          Cannot access memory at address 0xe
0000000f:   Failed to execute MI command:
          -data-disassemble -s 15 -e 91 -- 3
          Error message from debugger back end:
          Cannot access memory at address 0xe
00000010:   Failed to execute MI command:
          -data-disassemble -s 16 -e 92 -- 3
          Error message from debugger back end:
          Cannot access memory at address 0x10
00000011:   Failed to execute MI command:
          -data-disassemble -s 17 -e 93 -- 3
          Error message from debugger back end:
          Cannot access memory at address 0x10

...
...
and this all while the application still runs on the MCU, I'm confused to say the least.
Hi stdcerr,
When this bug comes, cpu may also stay in unknow state and the reset condition will not happen. You must check what is wrong both in hardware and software. There is a stack window in KDS. You can see the pc position and stack status before crash.
Regards,
Jing
Hi,
I can't think of any smart way to debug. If you believe this is caused by isr, you can toggle a gpio when in/out interrupt service code. Then shrink the position till find the problem.
Regards,
Jing

