- Forums
- Product Forums
- General Purpose MicrocontrollersGeneral Purpose Microcontrollers
- i.MX Forumsi.MX Forums
- QorIQ Processing PlatformsQorIQ Processing Platforms
- Identification and SecurityIdentification and Security
- Power ManagementPower Management
- Wireless ConnectivityWireless Connectivity
- RFID / NFCRFID / NFC
- MCX Microcontrollers
- S32G
- S32K
- S32V
- MPC5xxx
- Other NXP Products
- S12 / MagniV Microcontrollers
- Powertrain and Electrification Analog Drivers
- Sensors
- Vybrid Processors
- Digital Signal Controllers
- 8-bit Microcontrollers
- ColdFire/68K Microcontrollers and Processors
- PowerQUICC Processors
- OSBDM and TBDML
- S32M
-
- Solution Forums
- Software Forums
- MCUXpresso Software and ToolsMCUXpresso Software and Tools
- CodeWarriorCodeWarrior
- MQX Software SolutionsMQX Software Solutions
- Model-Based Design Toolbox (MBDT)Model-Based Design Toolbox (MBDT)
- FreeMASTER
- eIQ Machine Learning Software
- Embedded Software and Tools Clinic
- S32 SDK
- S32 Design Studio
- GUI Guider
- Zephyr Project
- Voice Technology
- Application Software Packs
- Secure Provisioning SDK (SPSDK)
- Processor Expert Software
-
- Topics
- Mobile Robotics - Drones and RoversMobile Robotics - Drones and Rovers
- NXP Training ContentNXP Training Content
- University ProgramsUniversity Programs
- Rapid IoT
- NXP Designs
- SafeAssure-Community
- OSS Security & Maintenance
- Using Our Community
-
- Cloud Lab Forums
-
- Knowledge Bases
- ARM Microcontrollers
- i.MX Processors
- Identification and Security
- Model-Based Design Toolbox (MBDT)
- QorIQ Processing Platforms
- S32 Automotive Processing Platform
- Wireless Connectivity
- CodeWarrior
- MCUXpresso Suite of Software and Tools
- MQX Software Solutions
-
- Home
- :
- MCUXpresso软件和工具
- :
- Kinetis Design Studio
- :
- Re: debug Cortex-M4F floatpoint
debug Cortex-M4F floatpoint
I experienced the following failed assertion when debugging Cortex-M4F code using floating point.
GCC-4-8-build/src/gdb/gdb/regcache.c:178: internal-error:
register_size: Assertion `regnum >= 0 && regnum <
(gdbarch_num_regs (gdbarch) + gdbarch_num_pseudo_regs (gdbarch))' failed.
All routine that pass a floating point value to the routine will failed when I set a breakpoint inside the routine. GDB crashes as soon as the break is encountered.
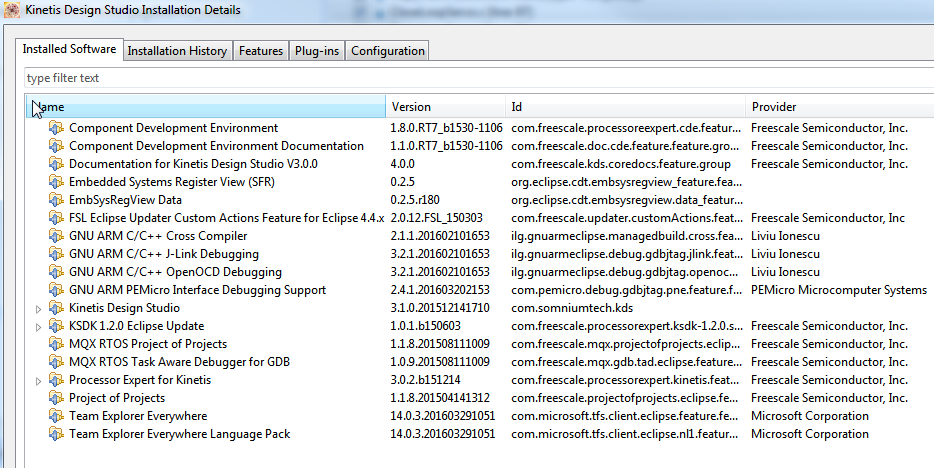
Kinetis Design Studio Version: 3.1.0
Eclipse Version: Luna SR2 (4.4.2)
已解决! 转到解答。
Hi Dan,
I heard back from PEMicro and fix should be next week. Exact wording:
We will post a new release of our GDB server mid-next week to our update site which has this fix.
Regards,
David
Hi,
I listed my compiler setting on Apr 18, 2016 8:00 AM as:
arm-none-eabi-gcc -mcpu=cortex-m4 -mthumb -mthumb-interwork -mfloat-abi=hard
-mfpu=fpv4-sp-d16 -Og -fmessage-length=0 -fsigned-char -ffunction-sections
-fdata-sections -fsingle-precision-constant -Wunused -Wuninitialized
-Wmissing-declarations -Wlogical-op -Waggregate-return -g3 -nostdinc
-D_AEABI_LC_CTYPE=C -D__STRICT_ANSI__=1 -D_DEBUG=1
-std=gnu11 -Wmissing-prototypes -Wstrict-prototypes
-fno-strict-aliasing -fms-extensions -finline-functions
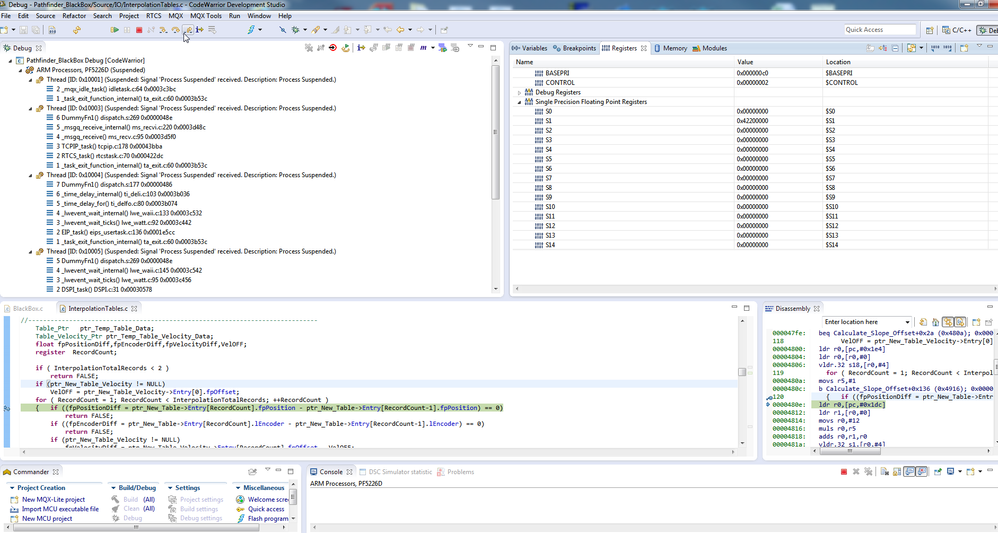
My program compile, linked and run fine. I have a large amount of floating point math in this program and It's all is working fine. My problem is with the debugger first I have no floating point register display.
The old compiler Version 10.6 I had floating point register
listed after the control register. I the compiler version 3.2 there are no
floating point register listed. I the Expressions windows all float are listed
as hex number very hard to interpreter.
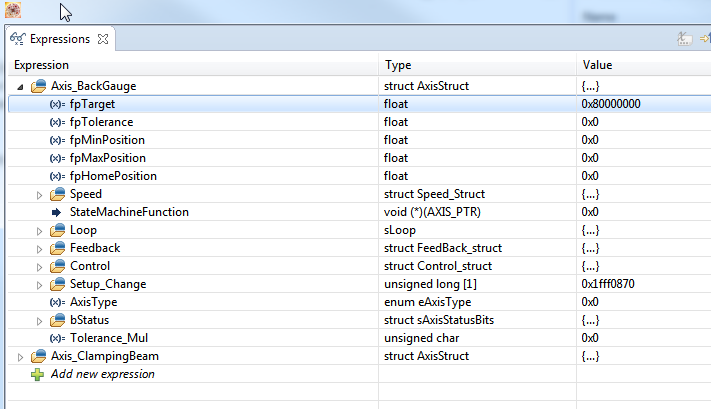
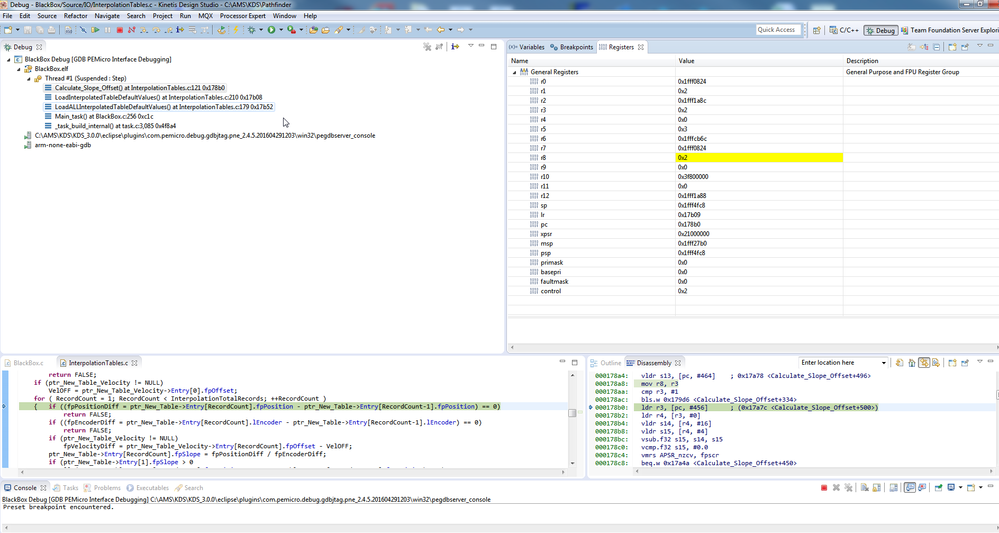
The second problem is when I set a break point in a subroutine that passes a float on the stack the debugger will crash when the break is encounter. I think the debugger is trying to read for float that was passed on the stack and get an error.
console window:
"GCC-4-8-build/src/gdb/gdb/regcache.c:178: internal-error:
register_size: Assertion `regnum >= 0 && regnum < (gdbarch_num_regs (gdbarch) + gdbarch_num_pseudo_regs (gdbarch))' failed."
These problem just make debugging harder. THis is the display from version 10.6 with floating point register.
Jim Burton
AMS Controls Inc.
314-344-3144 ext 108
Hi Jim,
the CodeWarrior debugger is a completely different debugger than the GNU GDB in KDS, so things are different by nature.
What I think is that somehow GDB thinks that your object files (or .elf) file is not using floating point. I believe this is an attribute somewhere in the ELF/Dwarf information. That's why I thought it could be something in your project setup.
Or are you linking other files/libraries with different EABI settings maybe?
If you create a project (btw, which device are you using?) with File > New > Kinetis Project, does it work correctly?
I hope this helps,
Erich
Hi,
I am working on optimizing in assembly a function that uses the FPU on a Kinetis KV31 (Cortex M4F) using KDS 3.2.0. I would like to verify the code by stepping through the instructions and inspecting the regular ARM registers (R0 - R15) and the floating-point registers (S0 - S31). After doing extensive online searching and looking through the KDS help, I have not found out a way to display any of the single precision registers S0 - S31 using the debugger (PE OSBDM/OSJTAG), in either Register View, EmbSys Registers View, or any other view. The debugger otherwise seems to be working fine and I can see the main core registers and peripheral registers for my target MCU.
Looking at the disassembly view, I can see that the executable includes FPU instructions (eg. vldm, vmul, etc.) and the core executes them without generating any exceptions - the FPU must be enabled and functional.
Compiler Command: C:/Freescale/KDS_v3/Toolchain/bin/arm-none-eabi-gcc -mcpu=cortex-m4 -mthumb -mfloat-abi=hard -mfpu=fpv4-sp-d16 -O0 -fmessage-length=0 -fsigned-char -ffunction-sections -fdata-sections -Wall -g3 -D"CPU_MKV31F512VLL12" -DARM_MATH_CM4 -I./include -std=gnu99 -DPRINTF_ADVANCED_ENABLE=1U -DFSL_RTOS_FREE_RTOS -DSDK_OS_FREE_RTOS -c -o "src/line_optimized.o" "src/line_optimized.s"
Linker Command: C:/Freescale/KDS_v3/Toolchain/bin/arm-none-eabi-gcc -mcpu=cortex-m4 -mthumb -mfloat-abi=hard -mfpu=fpv4-sp-d16 -O0 -fmessage-length=0 -fsigned-char -ffunction-sections -fdata-sections -Wall -g3 -D"CPU_MKV31F512VLL12" -DARM_MATH_CM4 -I./include -std=gnu99 -DPRINTF_ADVANCED_ENABLE=1U -DFSL_RTOS_FREE_RTOS -DSDK_OS_FREE_RTOS -save-temps -T "link/MKV31F512xxx12_flash.ld" -Xlinker --gc-sections --specs=nano.specs -specs=nosys.specs -Xlinker -z -Xlinker muldefs -Wl,-Map,"mighty_app.map" -o build/mighty_app.elf src/drivers/fsl_dac.o src/drivers/fsl_clock.o src/drivers/fsl_lpuart.o src/drivers/fsl_smc.o src/drivers/fsl_uart.o src/board/board.o src/board/clock_config.o src/board/pin_mux.o src/startup/startup_MKV31F51212.o src/startup/system_MKV31F51212.o src/utilities/fsl_debug_console.o src/generator_thread.o src/line_optimized.o src/main_app.o
Has anyone had luck accessing Cortex M4F FPU working registers (S0 - S31) through the KDS 3.2.0 debugger using PE OSBDM/OSJTAG?
Thank you,
Dan
Hi Dan,
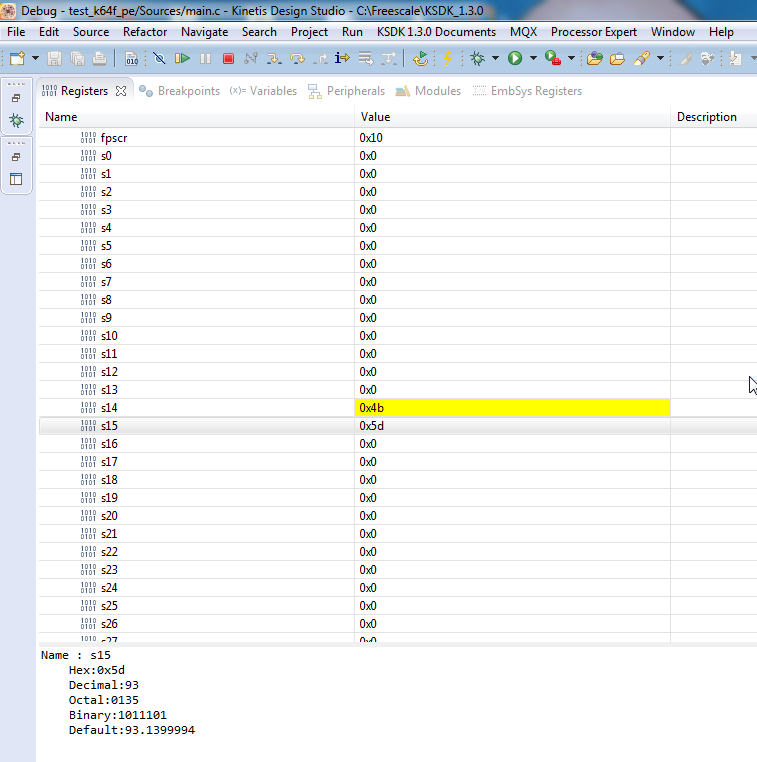
I'll try using KSDK_v2 with KDS_3.2 (and FRDM-KV31 if I can find one) later but I did a quick check using KSDK_v1.3+KDS3.1 using FRDM-K64F and I can see the floating point registers in the Register window as follows:
I added simple floating code example:
#if 1 //DES 1=test, 0=default code
unsigned int i;
float x,y,z;
x = 3.14;
y = 2.2;
for(i=0;i<10;i++) {
z = x*y;
y += i;
x += (2*i);
}
#endif
I could monitor the local variable in the Variables window and also see the Register s14 and s15 being used for floating point.
Regards,
David
Hi Dan,
I just tested this same setup on the FRDM-KV31F successfully.
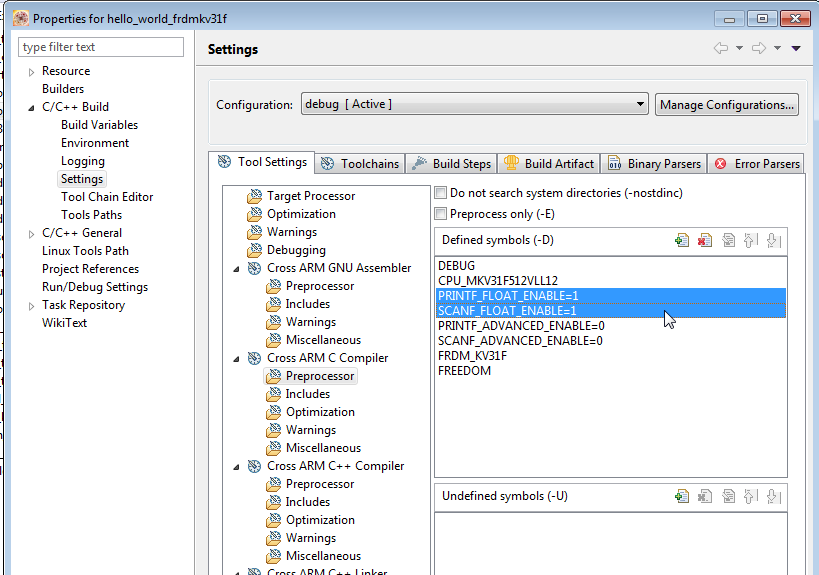
I used the HelloWorld demo project and to have the PRINTF working for %f float stuff I had to make following change in the properties:
Then recompiled and ran.
Terminal output:
hello world.
x = 93.139999y = 47.200001z = 2870.348145
Regards,
David
Hi David,
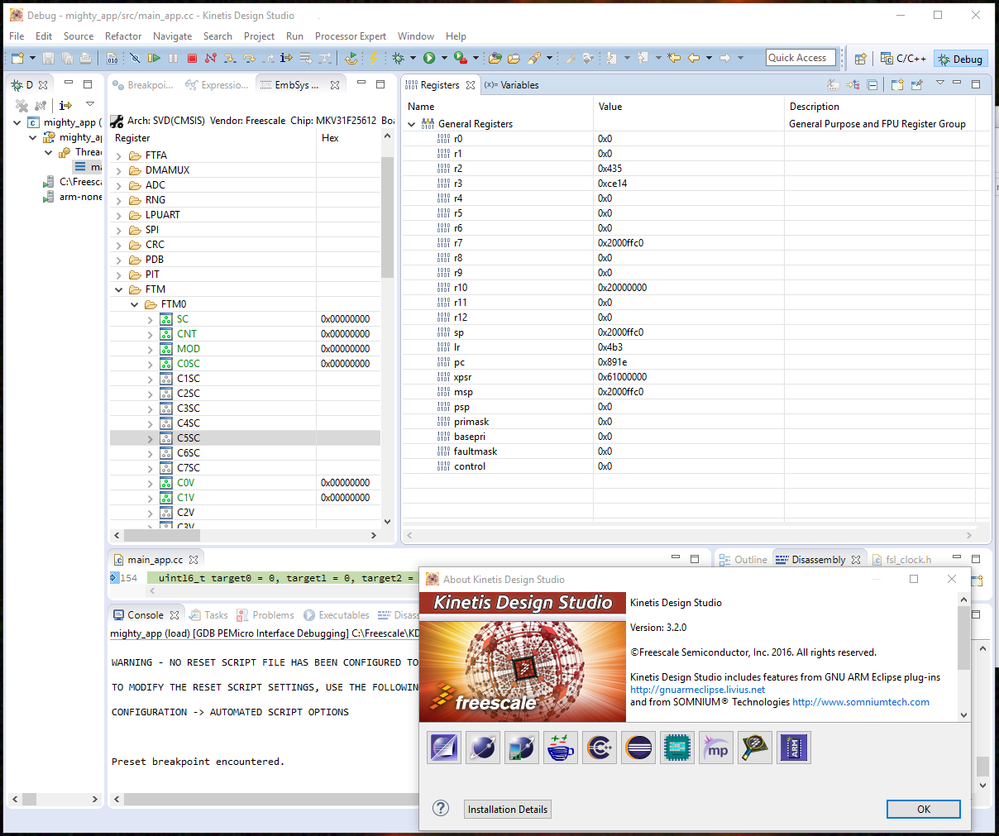
I followed your advice but I still can't get the FPU registers to show up in the Registers view as you have in your screen shot. Here is what my IDE looks like - peripheral registers on the left and core registers on the right.
Do you remember if you had to make any IDE changes to enable FPU registers to be included in the Registers view?
The alternative of using printf or similar console printing functionality from assembly language is not as convenient when stepping through code.
Thank you for your support,
Dan
Hi Dan,
Weird. Everything I try (creating new KSDK_v2 project for KV31Z or using existing KSDK_v2 projects) has the floating point registers in the Register window.
Did you try using the hello_world project as a test? You picture looks like you might have created a new project.
You might try closing that tab and re-opening by going to Window->Show View->Registers .
What Windows OS are you running? I'm on Windows 7 Professional 64-bit.
UPDATED:
Just ran another test. If I am using PEMicro USB MultiLink debugger hardware, I do not see the floating point registers listed in the Register window.
When I use the Segger JLink or Segger OpenSDA firmware for debugging, I see the floating point registers listed in the Register window!
I'm guessing you are using PEMicro OpenSDA firmware or debugger???
Regards,
David
Hi David,
You are correct, I am using the PEmicro USB Multilink, USB Multilink FX, Embedded OSBDM/OSJTAG - USB Port interface, and I am connecting to the target TWR-KV31F120 board using a simple USB cable without any external ICDs.
It seems like others are interested in a fix for this issue so please keep us updated once a fix is available.
I appreciate your support,
Dan
Hi Eric,
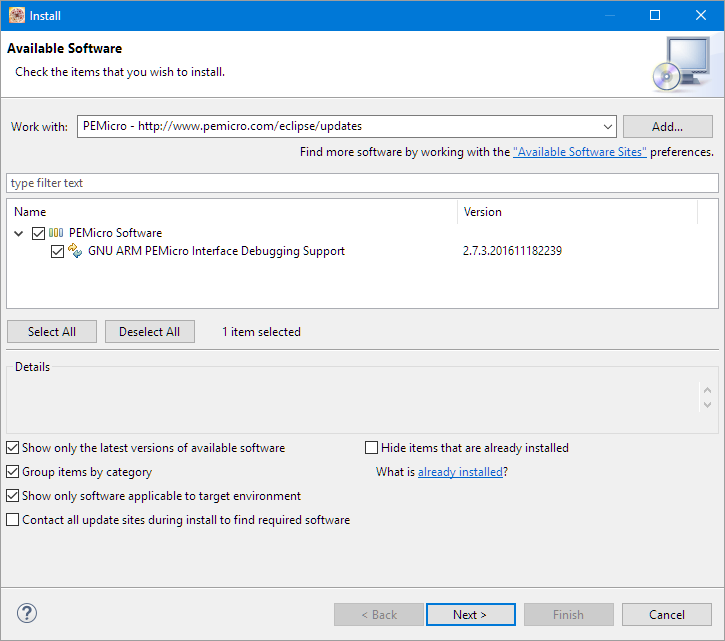
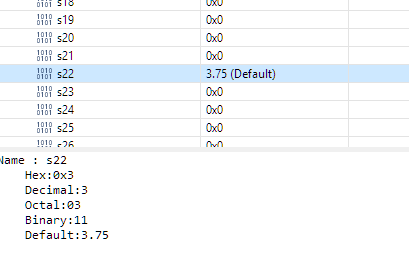
I downloaded this update and I can now see registers s0 - s31 listed under the General Registers section, and this is very useful for debugging. One minor nit is that the plugin can only display the values in Hex, Decimal, Octal, Binary and Default (which seems to be Decimal). These representations options are fine when working with fixed point values, but cumbersome when working with floating point values. I will likely keep a browser tab open to a hex to float conversion site such as this http://babbage.cs.qc.cuny.edu/IEEE-754/, which can convert hex based notation to the equivalent IEEE-754 floating point value.
If you happen to know of a better way to working with floating point registers please add a comment to this thread.
Thank you for your support.
All the best,
Dan
Hi Dan,
have you tried the 'default' format?
Related to that, see Debugging Variables in Hexadecimal with Eclipse | MCU on Eclipse and Show Floating Point Variable Bytes in Eclipse CDT | MCU on Eclipse .
I hope this helps,
Erich
Hi Erich,
I restarted KDS earlier today and now I do see floating point values being displayed when I select the "default" view. At this point it seems like I have full visibility into the MCU (registers and peripherals).
Thank you for the quick response!
Dan
David,
I confirmed this is the case with the PEMicro USB. I would love to have the floating point register views. Curious if there is a configuration setting that can enable them for the PEMicro.
Shawn
David,
Have you heard anything from PEMicro. I'm trying to write some FP assembly and I could really use this functionality. I saw there was a J-Link personality available for OpenSDA. Is this another path to getting a FP register view?
Shawn
Hi Jim,
I created a simple test case, and at least this one is working fine for me (see attached screenshot, using KDS v3.2.0) on a K22FN512.
My application (well, with FreeRTOS) does enable the floating point (FPU) unit. I assume the same is done on your side too?
void vPortEnableVFP(void) {
/* The FPU enable bits are in the CPACR. */
__asm volatile (
" ldr.w r0, =0xE000ED88 \n" /* CAPCR, 0xE000ED88 */
" ldr r1, [r0] \n" /* read CAPR */
" orr r1, r1, #(0xf<<20) \n" /* enable CP10 and CP11 coprocessors */
" str r1, [r0] \n" /* store to new value back */
: /* no output */
: /* no input */
: "r0","r1" /* clobber */
);
}
You might call the above code from main() to be sure your FPU is enabled.
Otherwise, it could be that your application might not be compiled with the correct floating point options? At least gdb complains about the register numbers.
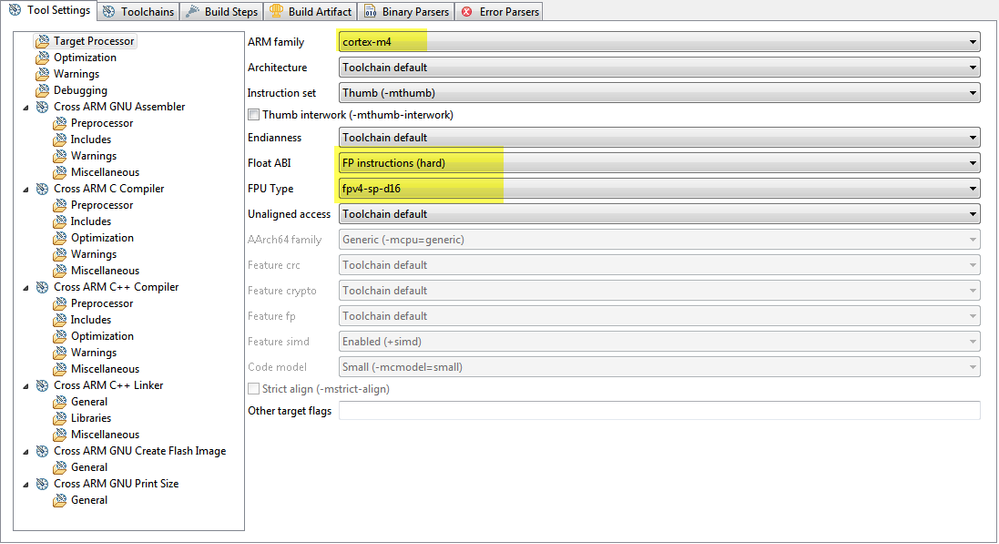
This is what I have:
So these options should result somthing like this (pay attention to the -mcpu and -mfloat and -mfpu options) for compiler and linker:
Building file: ../source/main.c
Invoking: Cross ARM C Compiler
arm-none-eabi-gcc -mcpu=cortex-m4 -mthumb -mfloat-abi=hard -mfpu=fpv4-sp-d16 -O0 -fmessage-length=0 -fsigned-char -ffunction-sections -fdata-sections -Wall -g3 -D_DEBUG=1 -DCPU_MK22FN512VLH12 -DUSB_STACK_FREERTOS_HEAP_SIZE=32768 -DUSB_STACK_FREERTOS -DFSL_RTOS_FREE_RTOS -DFRDM_K22F -DFREEDOM -I../freertos/Source/include -I../startup -I../board -I../utilities -I../freertos/Source/portable/GCC/ARM_CM4F -I../CMSIS -I../source ... -I../source/UTILITY -std=gnu99 -MMD -MP -MF"source/main.d" -MT"source/main.o" -c -o "source/main.o" "../source/main.c"
Finished building: ../source/main.c
Building target: FRDM-K22F_USB_Mouse_Kybd_SDK_v2.0.elf
Invoking: Cross ARM C++ Linker
arm-none-eabi-g++ -mcpu=cortex-m4 -mthumb -mfloat-abi=hard -mfpu=fpv4-sp-d16 -O0 -fmessage-length=0 -fsigned-char -ffunction-sections -fdata-sections -Wall -g3 -T "../MK22FN512xxx12_flash.ld" -Xlinker --gc-sections -Wl,-Map,"FRDM-K22F_USB_Mouse_Kybd_SDK_v2.0.map" -specs=nosys.specs -specs=nano.specs -Xlinker -z -Xlinker muldefs -o "FRDM-K22F_USB_Mouse_Kybd_SDK_v2.0.elf" ./utilities/fsl_debug_console.o ... ./board/pin_mux.o
Finished building target: FRDM-K22F_USB_Mouse_Kybd_SDK_v2.0.elf
I hope this helps,
Erich
I don't have a problem with print printing floating point number,
My program work fine, I print a to a log file with a lot floating point value to
a PC using Ethernet UDP messing. The problem I have is when I set a Breakpoint
in a subroutine that pass a float on the stack the debugger will crash when the
breakpoint is encounter see previse data.
Using KDS 3.2.0 MQX 4.2
Console window after crash:
I experienced the following failed assertion when debugging Cortex-M4F code using floating point.
GCC-4-8-build/src/gdb/gdb/regcache.c:178: internal-error:
register_size: Assertion `regnum >= 0 && regnum <
(gdbarch_num_regs (gdbarch) + gdbarch_num_pseudo_regs (gdbarch))' failed.
All routine that pass a floating point value on the stack will failed when I set a breakpoint inside the routine. GDB crashes as soon as the break is encountered.
The routine work fine I can put printf to a uart and see that all the floating point math is right.
JIM

