- Forums
- Product Forums
- General Purpose MicrocontrollersGeneral Purpose Microcontrollers
- i.MX Forumsi.MX Forums
- QorIQ Processing PlatformsQorIQ Processing Platforms
- Identification and SecurityIdentification and Security
- Power ManagementPower Management
- MCX Microcontrollers
- S32G
- S32K
- S32V
- MPC5xxx
- Other NXP Products
- Wireless Connectivity
- S12 / MagniV Microcontrollers
- Powertrain and Electrification Analog Drivers
- Sensors
- Vybrid Processors
- Digital Signal Controllers
- 8-bit Microcontrollers
- ColdFire/68K Microcontrollers and Processors
- PowerQUICC Processors
- OSBDM and TBDML
- S32M
-
- Solution Forums
- Software Forums
- MCUXpresso Software and ToolsMCUXpresso Software and Tools
- CodeWarriorCodeWarrior
- MQX Software SolutionsMQX Software Solutions
- Model-Based Design Toolbox (MBDT)Model-Based Design Toolbox (MBDT)
- FreeMASTER
- eIQ Machine Learning Software
- Embedded Software and Tools Clinic
- S32 SDK
- S32 Design Studio
- GUI Guider
- Zephyr Project
- Voice Technology
- Application Software Packs
- Secure Provisioning SDK (SPSDK)
- Processor Expert Software
- MCUXpresso Training Hub
-
- Topics
- Mobile Robotics - Drones and RoversMobile Robotics - Drones and Rovers
- NXP Training ContentNXP Training Content
- University ProgramsUniversity Programs
- Rapid IoT
- NXP Designs
- SafeAssure-Community
- OSS Security & Maintenance
- Using Our Community
-
- Cloud Lab Forums
-
- Knowledge Bases
- ARM Microcontrollers
- i.MX Processors
- Identification and Security
- Model-Based Design Toolbox (MBDT)
- QorIQ Processing Platforms
- S32 Automotive Processing Platform
- Wireless Connectivity
- CodeWarrior
- MCUXpresso Suite of Software and Tools
- MQX Software Solutions
-
- Home
- :
- MCUXpressoソフトウェアとツール
- :
- Kinetisデザインスタジオ
- :
- Adding HardFault handlers in KDS3/KSDK1.2?
Adding HardFault handlers in KDS3/KSDK1.2?
- RSS フィードを購読する
- トピックを新着としてマーク
- トピックを既読としてマーク
- このトピックを現在のユーザーにフロートします
- ブックマーク
- 購読
- ミュート
- 印刷用ページ
- 新着としてマーク
- ブックマーク
- 購読
- ミュート
- RSS フィードを購読する
- ハイライト
- 印刷
- 不適切なコンテンツを報告
I have read Erich Styger's blog Debugging Hard Faults on ARM Cortex-M | MCU on Eclipse regarding the creation of a separate fault handler for each fault type. Admittedly, I never actually used them in my previous project under KDS2/KSDK1.1, but I did see the option to select "own handler" in the Build Options for the CPU settings in PEx.
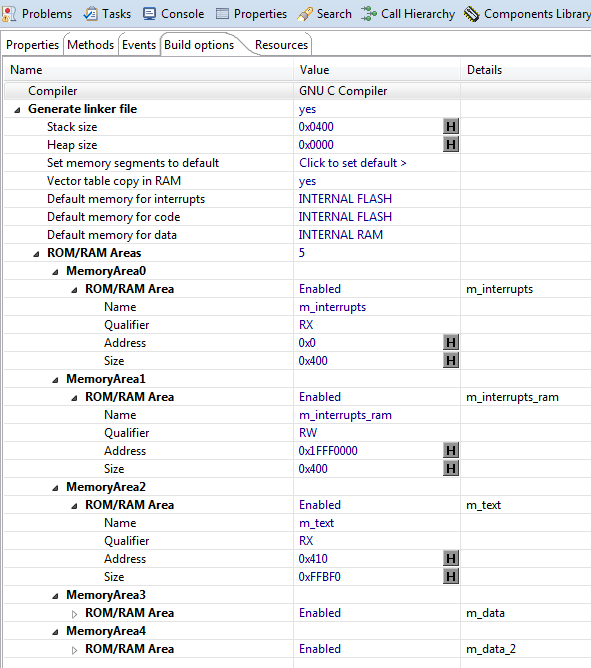
I'm trying to debug a problem with my application, and want to be able to see what sort of fault it's encountering, but I cannot find this PEx setting in KDS3/KSDK1.2. This is what I see:
Does anyone know what we are supposed to do in the new IDE?
解決済! 解決策の投稿を見る。
- 新着としてマーク
- ブックマーク
- 購読
- ミュート
- RSS フィードを購読する
- ハイライト
- 印刷
- 不適切なコンテンツを報告
The way to handle specific fault handlers in KDS 3.0 is to simply define your own fault handler functions. They are weak-linked. You can create fault_handlers.c and paste in this code:
- void HardFault_Handler(unsigned long *hardfault_args)
- {
- }
- void MemManage_Handler(unsigned long *hardfault_args)
- {
- }
- void BusFault_Handler(unsigned long *hardfault_args)
- {
- }
- void UsageFault_Handler(unsigned long *hardfault_args)
- {
- }
I have tested this with one of my applications that is currently crashing somehow, and when I add the handlers, I do end up in HardFault_Handler, and now just need to figure out how to debug it. ![]()
- 新着としてマーク
- ブックマーク
- 購読
- ミュート
- RSS フィードを購読する
- ハイライト
- 印刷
- 不適切なコンテンツを報告
Dave,
The Kinetis SDK changed the API, so that functionality and feature of Processor Expert is not any more available if you use the Kinetis SDK.
In some sense, it is not applicable any more for the SDK.
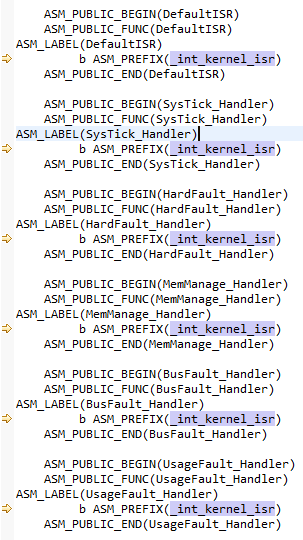
The Kintetis SDK uses its own vector table. You find that vector table with the vector names in the startup code (for MK64F e.g. this is SDK\platform\devices\MK64F12\startup\gcc\startup_MK64F12.S).
I hope this helps,
Erich
- 新着としてマーク
- ブックマーク
- 購読
- ミュート
- RSS フィードを購読する
- ハイライト
- 印刷
- 不適切なコンテンツを報告
I was wrong about it being a BusFault, so my evaluation must have been incorrect. I found that the fault handlers are all weak linked, so I just defined my own functions for HardFault_Handler, MemManage_Handler, BusFault_Handler, and UsageFault_Handler. When I set breakpoints in all three, HardFault_Handler was the one that got called. Can you help me to understand where I went wrong during my diagnosis?
- 新着としてマーク
- ブックマーク
- 購読
- ミュート
- RSS フィードを購読する
- ハイライト
- 印刷
- 不適切なコンテンツを報告
BlackNight ok, I'm trying my best here. I took your base assembly code and slightly modified it because r1 was 0, and I couldn't tell if the offending call was made from the main stack or process stack. I saw that r6 wasn't used in this context, so I just set it to 1 or 2, depending on the branch condition:
__asm volatile (
" movs r0,#4 \n"
" movs r1, lr \n"
" tst r0, r1 \n"
" beq _MSP \n"
"movs r6,#1\n"
" mrs r0, psp \n"
" b _HALT \n"
"_MSP: \n"
"movs r6,#2\n"
" mrs r0, msp \n"
"_HALT: \n"
" ldr r1,[r0,#20] \n"
" bkpt #0 \n"
);
Since r6 was 2 after I stepped over this function, the problem must be on the main stack, which I assume is the non-RTOS task stack. If r1 is 0, does this mean that somehow main is trying to call a method on a null pointer?
- 新着としてマーク
- ブックマーク
- 購読
- ミュート
- RSS フィードを購読する
- ハイライト
- 印刷
- 不適切なコンテンツを報告
Thanks, Erich. That does help for sure. But now I just have to figure out how the fault handlers work. It does look like all of them point to the same handler (_int_kernel_isr), so now I'm just wading through code to see how I'm supposed to trap the error. I'll try making my own functions and see if any of them get called -- at the moment, it appears that there isn't a fault that's causing my code to stop executing. I'll post my findings.
EDIT - I was expecting the fault handlers to call _int_default_isr...
I guess this implies that I need to read up on these macros -- elsewhere in the code it looks like _int_default_isr is intended for unhandled exceptions. So I put a breakpoint there and it does hit it. So this means my application did stop due to an unhandled exception, so now I just have to figure out which one.
EDIT - BlackNight looking at startup_MK64F12.S, I see the list of vector numbers. Being mostly assembly-illiterate, I took this info:
and working backwards up the list, it looks like NMI_Handler would then be 0. When I hit the breakpoint in _int_default_isr, it looked like the unhandled exception had a vector number of 3, which is BusFault_Handler. Reading dereksnell's post Tracking down Hard Faults , it sounds like it's likely an invalid memory address that's causing my problem, which sounds right since merely calling netconn_accept() (modified to simply return 0) causes the crash to occur. He said it could also be accessing a peripheral register before the clock is enabled, but I don't think this is the case since I can ping the device up until the point where I call netconn_accept.
Can you recommend any other debugging strategies? In the meantime, I will try to decipher your post Debugging Hard Faults on ARM Cortex-M | MCU on Eclipse to see if I can determine what causes the memory corruption.
Thank you!


